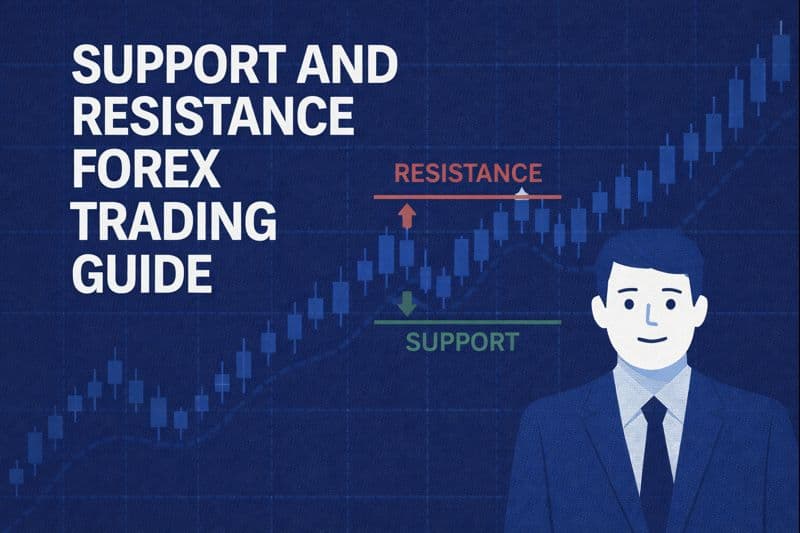
Support and Resistance in Forex Trading: Guide And Strategies
Learn support and resistance forex trading from basics. Discover how to identify key levels, trade bounces and breakouts, and avoid common mistakes beginners make.

What Are Support and Resistance Levels?
If you’re new to forex trading, you’ve probably heard traders talk about “support” and “resistance.” These terms sound technical, but the concept is simple once you understand it.
Support is a price level where buying pressure is strong enough to prevent the price from falling further. Think of it as a floor that keeps the price from dropping.
Resistance is a price level where selling pressure is strong enough to prevent the price from rising higher. Think of it as a ceiling that keeps the price from climbing.
These aren’t magical lines that price mysteriously respects. They form because of real market forces: supply and demand.
The Supply and Demand Basics
Forex markets operate on the same fundamental principle as any other market: supply and demand determine price.
When demand exceeds supply at a certain price level, buyers outnumber sellers. This creates support. Price can’t fall below that level because too many buyers are willing to purchase at that price.
When supply exceeds demand at a certain price level, sellers outnumber buyers. This creates resistance. Price can’t rise above that level because too many sellers are willing to sell at that price.
Let’s use a real-world analogy. Imagine you’re selling coffee. You price it at $5 per cup. At that price, you have more buyers than you can handle. That $5 price becomes a support level because every time the price dips toward $5, buyers rush in.
Now imagine you raise the price to $10. Suddenly, nobody wants to buy. That $10 price becomes resistance because every time price approaches $10, sellers appear but buyers disappear.
The forex market works exactly like this, except with trillions of dollars traded every day across currency pairs like EUR/USD, GBP/USD, and USD/JPY.
The Floor and Ceiling Analogy
The simplest way to visualize support and resistance is to think of them as floors and ceilings in a building.
Support is the floor. Price bounces off it like a ball hitting the ground. Each time price approaches support, buyers step in and push price back up.
Resistance is the ceiling. Price hits it and falls back down. Each time price approaches resistance, sellers step in and push price back down.
This analogy works well for beginners because it creates a visual image. When you look at a forex chart, you can literally see price bouncing between these floors and ceilings.
But here’s where it gets interesting: sometimes the floor breaks and becomes the new ceiling. Sometimes the ceiling breaks and becomes the new floor. We’ll explore this “role reversal” concept later in this guide.

Why Prices Bounce at Support and Resistance Levels
You might wonder: why does price respect these levels at all? Why doesn’t it just move randomly?
The answer lies in market psychology and the collective behavior of thousands of traders around the world.
Market Psychology and Collective Trader Behavior
Forex trading is a battle between bulls (buyers) and bears (sellers). Support and resistance levels form at prices where this battle reaches a temporary equilibrium.
When price approaches a known support level, several things happen simultaneously:
- Bargain hunters step in. Traders who’ve been watching see the price as “cheap” and start buying.
- Short sellers take profit. Traders who bet on price falling close their positions by buying, which adds to buying pressure.
- Stop losses trigger. Traders who were short often place their stop-loss orders near support. When these trigger, they automatically buy, pushing price up.
The same dynamics work in reverse at resistance levels. Profit-takers sell, new short sellers enter, and stop-loss orders from long positions trigger selling.
This collective behavior creates a self-fulfilling prophecy. The more traders believe a level will hold, the more likely it is to hold because they all act on that belief.
Order Clustering and Market Microstructure
Here’s something most beginner guides don’t tell you: support and resistance exist because of how orders accumulate in the market.
Modern forex markets operate through electronic order books. When you place a trade, you’re either matching an existing order or adding a new order to the book.
Buy orders cluster at certain price levels. Sell orders cluster at other levels. When price reaches a level with heavy order clustering, it either bounces or breaks through depending on the strength of those orders.
Research into market microstructure shows that order flow imbalance is a fundamental variable that quantifies the net difference between supply and demand. When buy orders significantly outnumber sell orders at a specific price, that price becomes support. When sell orders dominate, that price becomes resistance.
This isn’t just theory. Studies have shown that order flow is the proximate determinant of price in all market microstructure models. Once order flow is communicated to the market, it’s immediately reflected in price movement.
Round Number Psychology
Traders are human, and humans love round numbers.
Look at any major currency pair and you’ll notice that price often stalls or reverses near round numbers like 1.3000, 1.3500, or 1.4000 on EUR/USD.
Why? Because traders favor certain trigger rates when placing orders. They’re more likely to set take-profit orders at 1.3000 than 1.2997. They’re more likely to place stop-loss orders at 1.3100 than 1.3103.
This tendency creates asymmetric clustering near round numbers. Take-profit orders cluster just before round numbers, while stop-loss orders cluster just after them.
The result? Price often struggles to break through round numbers cleanly. Instead, it hovers near them, creating natural support and resistance zones.
Academic research has confirmed this phenomenon. Studies show that the more zeros a price level has, the stronger it tends to be as support or resistance. A level like 1.3000 is stronger than 1.3050, which is stronger than 1.3015.

How to Identify Support and Resistance Levels
Now that you understand what support and resistance are and why they work, let’s get practical. How do you actually find these levels on a chart?
There are several methods. Professional traders typically use all of them together to identify the strongest levels.
Previous Swing Highs and Lows
This is the most fundamental method and the one you should master first.
Open any forex chart and look for points where price reversed direction. These turning points are called swing highs and swing lows.
A swing high is a peak where price was rising, stopped, and started falling. This becomes a resistance level.
A swing low is a valley where price was falling, stopped, and started rising. This becomes a support level.
The logic is simple: if price reversed at a level once, it might reverse there again. The more times price reverses at the same level, the stronger that level becomes.
Here’s how to find them:
- Open a daily chart of your chosen currency pair
- Zoom out so you can see several months of price history
- Look for obvious peaks and valleys where price clearly reversed
- Draw horizontal lines at those levels
- Pay special attention to levels that were tested multiple times
Don’t draw lines at every tiny wiggle in price. Focus on the major turning points that are obvious even when you zoom out.
Round Numbers (Psychological Levels)
As we discussed earlier, round numbers act as natural support and resistance because traders cluster orders near them.
To use this method:
- Identify major round numbers on your chart: 1.3000, 1.3500, 1.4000, etc.
- The more zeros, the more significant: 1.3000 is stronger than 1.3050
- Watch how price behaves as it approaches these levels
- Combine round numbers with other methods for stronger signals
Round numbers work best on major pairs like EUR/USD, GBP/USD, and USD/JPY because these have the highest trading volume and the most trader attention.
On exotic pairs with lower liquidity, round numbers may be less reliable because fewer traders are watching those specific levels.
Historical Price Points
Sometimes support and resistance levels form at historically significant price points, even if they haven’t been tested recently.
For example:
- All-time highs or lows for a currency pair
- Prices where major economic events occurred
- Levels that held significance months or years ago
These historical levels matter because traders remember them. When price approaches a level where something significant happened in the past, traders pay attention.
To find historical levels, zoom out to weekly or monthly charts. Look for major turning points from years past. These ancient levels can suddenly become relevant again when price returns to them.
High-Volume Areas
Volume tells you where traders are most active. Areas with high trading volume often become support or resistance because they represent prices where many traders have positions.
When analyzing volume for support and resistance:
- High volume nodes represent prices where significant trading occurred. These act as magnets for future price action.
- Low volume nodes indicate prices that were quickly rejected. Price tends to move fast through these areas.
- Point of control shows the price with maximum volume, often serving as a pivot point.
Not all retail forex platforms provide detailed volume data, but some do. If yours doesn’t, you can use volume profile indicators available for MetaTrader 4 and 5.
Professional traders who run automated systems often incorporate volume analysis into their algorithms, letting their Expert Advisors identify high-volume zones across multiple pairs simultaneously.
Dynamic vs Static Support and Resistance
So far, we’ve discussed horizontal levels that don’t move. These are called static support and resistance.
But there’s another type that moves with price: dynamic support and resistance.
Static Levels: Horizontal Lines
Static levels are fixed price points that don’t change as new candles form. When you draw a horizontal line at 1.3000, it stays at 1.3000 forever.
Advantages of static levels:
- Easy to identify and draw
- Clear and objective
- Everyone sees the same levels
- Work well for longer-term analysis
Disadvantages:
- Don’t adapt to changing market conditions
- Can become less relevant as time passes
- May miss levels that move with trend
Dynamic Levels: Moving Averages and Trendlines
Dynamic support and resistance moves as new price data comes in. The most common forms are moving averages and trendlines.
Moving averages are calculated based on recent price action. As new candles form, the moving average adjusts. Popular choices include:
- 20-period moving average for short-term dynamic levels
- 50-period moving average for medium-term levels
- 200-period moving average for long-term levels
During a strong uptrend, price often bounces off the moving average instead of falling to horizontal support. The moving average acts as dynamic support that moves up with the trend.
During a strong downtrend, price often bounces off the moving average instead of rising to horizontal resistance. The moving average acts as dynamic resistance that moves down with the trend.
Trendlines connect a series of swing highs or swing lows. They’re diagonal rather than horizontal, following the angle of the trend.
In an uptrend, you draw a trendline connecting higher swing lows. This becomes dynamic support.
In a downtrend, you draw a trendline connecting lower swing highs. This becomes dynamic resistance.
The key advantage of dynamic levels is that they adapt to market conditions. When markets are trending strongly, dynamic levels often work better than static horizontal levels.
How Automated Systems Monitor Support and Resistance 24/7
One of the biggest advantages of using a forex VPS is the ability to run automated systems that monitor support and resistance levels across multiple currency pairs simultaneously. While you sleep, your Expert Advisors can detect when price approaches key levels and execute trades based on your programmed rules. This is especially valuable in forex markets that operate 24 hours a day across global sessions.
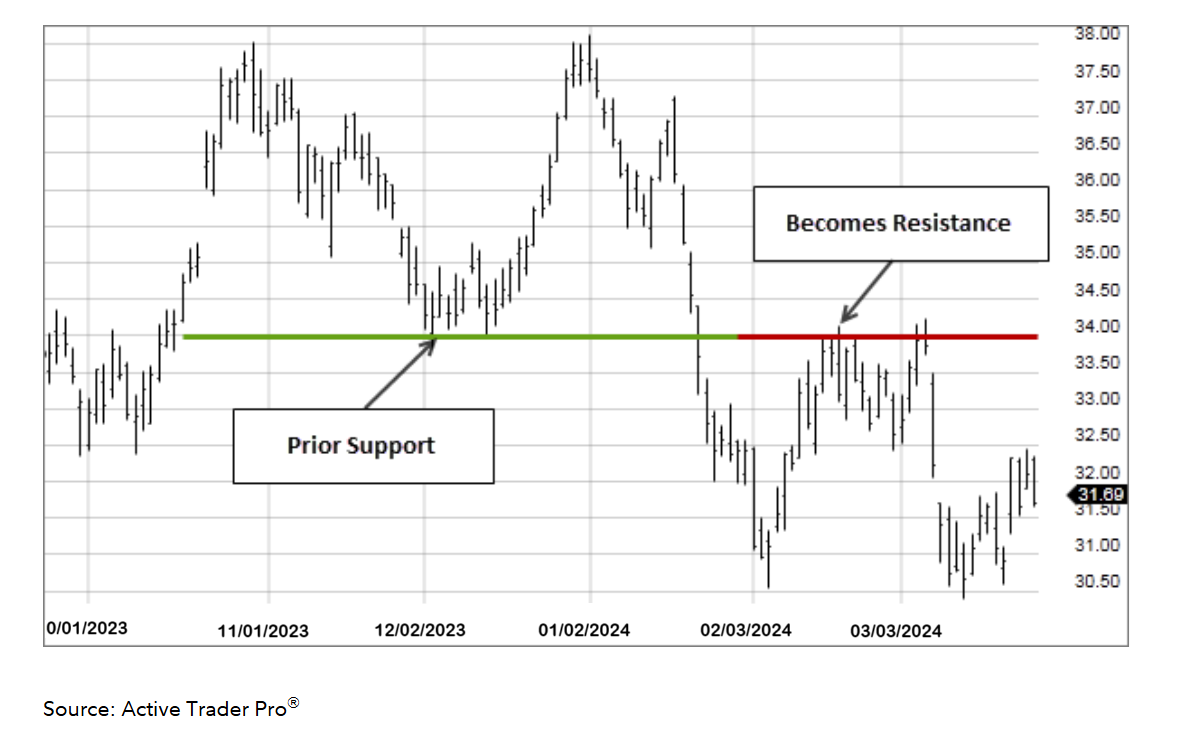
The Flip Concept: Support Becomes Resistance and Vice Versa
One of the most powerful concepts in support and resistance trading is the role reversal phenomenon.
When support breaks, it often becomes new resistance. When resistance breaks, it often becomes new support.
This isn’t magic. It’s market psychology at work.
Why Roles Reverse
Let’s walk through an example with EUR/USD trading at 1.3000, a known support level.
Scenario 1: Support holds
Price drops to 1.3000. Buyers step in. Price bounces back up. The support level is reinforced. Traders remember that 1.3000 is a good place to buy.
Scenario 2: Support breaks
Price drops to 1.3000. This time, the buying pressure isn’t strong enough. Price breaks below 1.3000 and continues falling to 1.2900.
What happens to all the traders who bought at 1.3000 thinking it was support?
They’re now in losing positions. They’re watching EUR/USD trade at 1.2900, and they’re down 100 pips.
Many of these traders place mental or actual stop-loss orders to “get out at break-even if price comes back.” Where do they place these orders? At 1.3000, their entry price.
Now imagine price rallies from 1.2900 back toward 1.3000. As it approaches, all those traders who bought at 1.3000 start selling to get out at break-even. Their selling creates resistance at 1.3000.
The old support level has flipped to become new resistance.
This role reversal happens because of pain. Traders who made wrong decisions at a level create new trading activity when price returns to that level.
How to Trade the Flip
Smart traders watch for these flips because they create high-probability trading opportunities.
Here’s the strategy:
- Identify a strong support level that has held multiple times
- Watch for a clean break below that level with strong momentum
- Wait for price to rally back to the broken level
- Enter a short position when price reaches the old support (now resistance)
- Place your stop-loss slightly above the level
- Take profit at the next support level below
The same strategy works in reverse when resistance breaks and becomes new support.
The key is patience. Don’t chase breakouts. Wait for the retest of the broken level. That’s where the high-probability setup appears.
Drawing Zones vs Exact Lines
Here’s a mistake almost every beginner makes: drawing support and resistance as exact lines.
Markets don’t work with mathematical precision. Price doesn’t reverse at 1.30000 every single time. Sometimes it reverses at 1.30015. Sometimes at 1.29985.
This is why professional traders draw zones instead of lines.
Why Zones Are More Realistic
A zone is a range of prices where support or resistance exists, rather than a single exact price.
For example, instead of drawing a line at exactly 1.3000, you might draw a zone from 1.2990 to 1.3010. This 20-pip zone accounts for:
- Spread differences between brokers
- Liquidity variations at different times
- Order execution happening at slightly different prices
- Stop-hunting by large players who push price briefly beyond levels
When you use zones, you give yourself flexibility. You’re not waiting for price to hit an exact level before acting. Instead, you’re watching for price to enter a zone and then confirming with other signals.
How to Draw Effective Zones
Here’s a practical approach for drawing support and resistance zones:
- Identify the general area where price has reversed multiple times
- Mark the highest high in that area (for resistance zones)
- Mark the lowest low in that area (for support zones)
- Draw your zone between these two points
- Adjust the width based on timeframe (higher timeframes need wider zones)
As a general rule:
- 15-minute charts: 5-10 pip zones
- 1-hour charts: 10-20 pip zones
- 4-hour charts: 20-30 pip zones
- Daily charts: 30-50 pip zones
These are guidelines, not rules. Volatile pairs like GBP/JPY need wider zones than stable pairs like EUR/CHF.
The zone approach also helps you avoid the frustration of seeing price miss your level by a few pips before reversing. With zones, those near-misses still count as touches.
Breakouts and False Breakouts
Not all breakouts are created equal. Some are real, leading to strong moves. Others are false, trapping traders who jumped in too early.
Learning to tell the difference is crucial for successful trading.
What Is a Breakout?
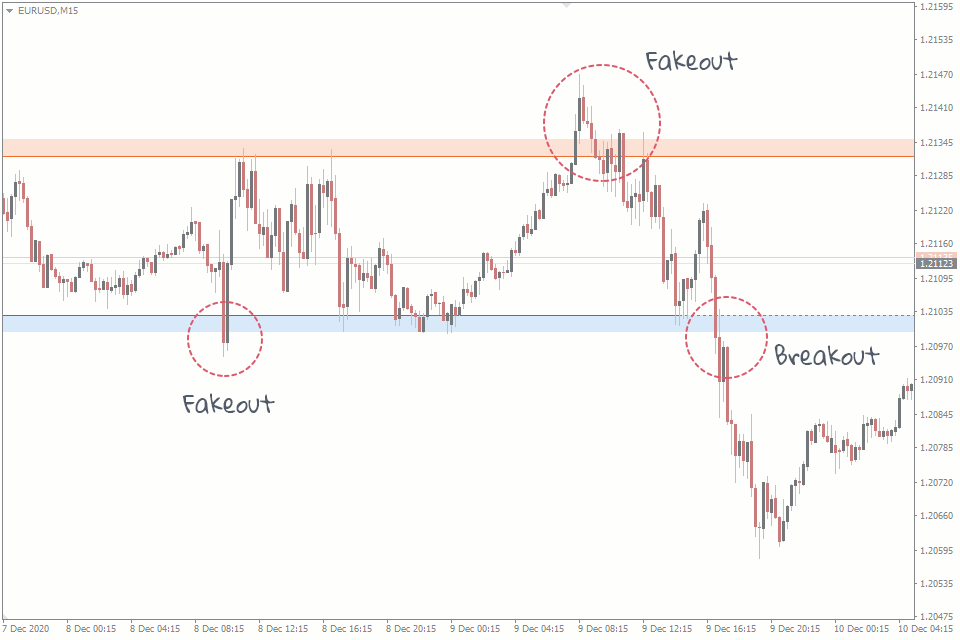
A breakout occurs when price moves decisively beyond a support or resistance level and continues in that direction.
For example, if EUR/USD has resistance at 1.3500 and price breaks above 1.3500 and continues to 1.3600, that’s a breakout.
Breakouts are important because they signal a shift in market dynamics. When a level that held for weeks or months suddenly breaks, it means the supply/demand balance has changed significantly.
What Is a False Breakout?
A false breakout (also called a fakeout) occurs when price briefly moves beyond a level but then quickly reverses back.
Using the same example, if EUR/USD breaks above 1.3500, reaches 1.3515, and then falls back below 1.3500, that’s a false breakout.
False breakouts are traps. They lure in traders who think a breakout is happening, only to reverse and stop them out.
Why do false breakouts happen?
- Stop hunting: Large players push price beyond levels to trigger retail stop losses
- Liquidity grabs: Market makers need liquidity and briefly push price to find orders
- Weak momentum: Price breaks the level but doesn’t have enough momentum to continue
- News reaction: Price spikes on news then settles back
How to Identify Real Breakouts
Here are the key characteristics of genuine breakouts:
1. Strong momentum
Real breakouts happen with conviction. The candle that breaks the level is usually larger than recent candles, showing strong momentum.
2. Increased volume
If you have access to volume data, genuine breakouts show increased volume. This confirms that many traders are participating in the move.
3. Clean close beyond the level
Don’t count a breakout until the candle closes beyond the level. Wicks that poke through don’t count. The candle body must close beyond the level.
4. No immediate reversal
After breaking, price should continue moving away from the level. If price breaks and immediately comes back, be suspicious.
5. Retest and continuation
The most reliable breakouts retest the broken level and then continue. This retest is your opportunity to enter with confirmation.
Confirmation Techniques
Smart traders don’t trade breakouts blindly. They wait for confirmation:
The close-beyond rule: Wait for a candle to close at least 10-20 pips beyond the level (depending on timeframe).
The retest strategy: Wait for price to break, pull back to retest the level as new support/resistance, then continue. Enter on the retest rather than the initial break.
The two-candle rule: Wait for two consecutive candles to close beyond the level before entering.
The momentum filter: Only take breakouts in the direction of the larger trend on higher timeframes.
Using confirmation techniques reduces your risk of getting caught in false breakouts. Yes, you might miss the very first pips of a move. But you’ll avoid the painful losses from fakeouts.
Watch: Support and Resistance Tutorial for Beginners
This comprehensive video tutorial covers the fundamentals of identifying and trading support and resistance levels in forex markets.
Trading Strategies Using Support and Resistance
Now let’s get into practical trading strategies. These are the three main ways traders profit from support and resistance levels.
Strategy 1: Trading the Bounce
This is the most straightforward strategy and the best one for beginners to master first.
The concept: When price approaches support, you buy expecting it to bounce. When price approaches resistance, you sell expecting it to bounce down.
Step-by-step for buying at support:
- Identify a strong support level that has held at least twice before
- Wait for price to approach within your support zone
- Look for bullish confirmation: a bullish candlestick pattern, bullish divergence on RSI, or a bullish engulfing candle
- Enter a long position when you get confirmation
- Place your stop-loss 20-30 pips below the support level (adjust for volatility)
- Set your take-profit at the next resistance level above
- Use at least a 1:2 risk-to-reward ratio (if you risk 30 pips, target at least 60 pips profit)
Step-by-step for selling at resistance:
- Identify a strong resistance level that has held at least twice before
- Wait for price to approach within your resistance zone
- Look for bearish confirmation: a bearish candlestick pattern, bearish divergence, or a bearish engulfing candle
- Enter a short position when you get confirmation
- Place your stop-loss 20-30 pips above the resistance level
- Set your take-profit at the next support level below
- Use at least a 1:2 risk-to-reward ratio
Advantages of bounce trading:
- Clear entry and exit points
- Easy to calculate risk-to-reward
- Works well in ranging markets
- Simple enough for beginners
Disadvantages:
- Doesn’t work in trending markets
- Vulnerable to breakouts
- Requires patience to wait for confirmation
Strategy 2: Trading the Breakout
When levels break, they can lead to strong trending moves. Breakout traders aim to catch these moves early.
The concept: Instead of expecting price to bounce off a level, you’re expecting it to break through and continue in that direction.
Step-by-step for breakout trading:
- Identify a strong support or resistance level where price has been consolidating
- Look for signs of building pressure: narrowing price action, declining volatility, or a tightening range
- When price breaks the level with strong momentum and increased volume, wait for confirmation
- Enter after the candle closes beyond the level (use the close-beyond rule)
- Or wait for a retest of the broken level as new support/resistance and enter there
- Place your stop-loss on the opposite side of the broken level
- Set your take-profit at the next major level in the direction of the breakout
- Consider trailing your stop as the move develops
Advantages of breakout trading:
- Catches the beginning of strong trends
- Large profit potential
- Works well in trending markets
- Clear invalidation point (if price returns inside the range)
Disadvantages:
- High failure rate due to false breakouts
- Requires good timing and confirmation
- Can be emotionally challenging (fear of missing out)
Strategy 3: Trading the Retest
This is the most reliable strategy because it combines the logic of both bounces and breakouts.
The concept: After a level breaks, price often returns to retest it as new support or resistance. This retest offers a low-risk, high-probability entry.
Step-by-step for retest trading:
- Identify a breakout of a significant level
- Don’t chase the initial breakout move
- Wait patiently for price to pull back to the broken level
- When price retests the level, look for confirmation that it’s holding as new support/resistance
- Enter when you get confirmation (a bounce candle, rejection wick, or bullish/bearish engulfing)
- Place your stop-loss on the opposite side of the level
- Target the recent high/low that formed after the breakout
- If that target is hit, hold a portion of your position for the larger move
Advantages of retest trading:
- Better entry price than chasing the breakout
- Tighter stop-loss possible
- Higher probability of success
- Less stressful than breakout trading
Disadvantages:
- Sometimes price doesn’t return for a retest
- Requires patience
- You might miss very strong breakouts that don’t retest
Common Mistakes When Using Support and Resistance
Even traders who understand support and resistance conceptually often make these mistakes that cost them money.
Mistake 1: Drawing Too Many Lines
Your chart shouldn’t look like a rainbow of horizontal lines covering every possible price level.
When you draw too many levels, you create analysis paralysis. Every price becomes both support and resistance. You have no clear levels to trade.
Solution: Focus on the obvious levels. If you zoom out and squint at your chart, you should only see the major turning points. Draw levels only at these points. Aim for 3-5 major levels maximum on any given timeframe.
Mistake 2: Ignoring Timeframe Context
A support level on a 15-minute chart is not as significant as a support level on a daily chart.
Beginners often draw levels on short timeframes and expect them to hold with the same strength as levels on longer timeframes. This leads to losses.
Solution: Use multiple timeframe analysis. Start with the daily chart to identify major levels. Then zoom to 4-hour and 1-hour charts for entry timing. Levels that align across multiple timeframes are the strongest.
Mistake 3: Not Waiting for Confirmation
Seeing price approach a support level and immediately buying is a recipe for pain.
Support levels fail. Sometimes what looks like support is just a pause before price continues falling.
Solution: Always wait for confirmation before entering. Use candlestick patterns, momentum indicators, or simply wait for a clear bounce before committing capital. The few pips you might miss by waiting for confirmation are worth avoiding the losses from failed levels.
Mistake 4: Using Exact Lines Instead of Zones
We covered this earlier, but it’s worth repeating because it’s such a common mistake.
Markets aren’t precise. Thinking support is exactly at 1.30000 and ignoring price action at 1.29990 is unrealistic.
Solution: Always draw zones, not lines. Give yourself room to work with. A 20-30 pip zone on major timeframes accounts for normal market noise and gives you flexibility.
Mistake 5: Fighting the Trend
Buying at support when the overall trend is down is low probability. Selling at resistance when the overall trend is up is low probability.
Support and resistance work best when aligned with the larger trend.
Solution: Identify the trend on a higher timeframe first. In uptrends, focus on buying at support and ignoring resistance. In downtrends, focus on selling at resistance and ignoring support. Trade with the trend, not against it.
Mistake 6: No Risk Management
Even the best support and resistance setups fail sometimes. Trading without stop-losses or proper position sizing will eventually wipe out your account.
Solution: Always use stop-losses. Risk no more than 1-2% of your account on any single trade. Calculate your position size based on your stop distance. If support is at 1.3000 and you place your stop at 1.2970 (30 pips), adjust your position size so that 30 pips equals only 1-2% of your account.
Mistake 7: Overcomplicating the Analysis
Some traders combine support and resistance with dozens of indicators, creating such complex systems that they can’t make decisions.
Solution: Keep it simple. Support and resistance work on their own. If you want to add indicators, limit yourself to one or two complementary tools like RSI or moving averages. More is not better in trading.
Watch: How to Draw Support and Resistance Correctly
Learn the proper techniques for drawing support and resistance zones on your forex charts with this detailed tutorial.
Automated Trading and Support/Resistance Levels
Many traders use Expert Advisors and trading algorithms that incorporate support and resistance logic.
The advantage? Automated systems can monitor dozens of currency pairs simultaneously, detecting when price approaches key levels across all of them.
How Algorithms Use Support and Resistance
Modern trading algorithms identify support and resistance levels in several ways:
- Historical price analysis: The algorithm scans past price data to find swing highs and lows that served as turning points
- Volume profile analysis: The algorithm identifies high-volume nodes that attract price
- Round number detection: The algorithm monitors psychological levels like .0000 and .5000
- Real-time monitoring: The algorithm watches multiple pairs 24/7, alerting when price approaches predefined levels
Expert Advisors can execute trades automatically when price reaches support or resistance, following the strategies we discussed earlier.

Running Automated Systems 24/7
Forex markets operate 24 hours a day, five days a week. Opportunities arise at all hours across different trading sessions.
The problem? You can’t sit in front of your computer 24 hours a day monitoring every currency pair.
This is where automated systems shine, and why many traders use a forex VPS to run their trading robots continuously. A VPS ensures your systems monitor the markets without interruption, even when your personal computer is off.
With 1ms latency or less to major broker servers, a properly configured VPS eliminates execution delays that can cause slippage when your algorithm tries to enter at specific support or resistance levels.
For more information on automated trading strategies, check out our guide on forex algorithmic trading strategies and learn more about forex Expert Advisors.
Frequently Asked Questions
What is the difference between support and resistance in forex?
Support is a price level where buying pressure is strong enough to prevent the price from falling further. It acts like a floor. Resistance is a price level where selling pressure is strong enough to prevent the price from rising higher. It acts like a ceiling. Both form because of collective trader behavior and order clustering at specific price points.
How do I identify support and resistance levels on a chart?
Look for previous swing highs and lows where price reversed direction multiple times. Watch for round numbers like 1.3000 or 1.3500 where traders cluster orders. Identify historical price points where significant reversals occurred. Use volume analysis to find high-volume areas that attract price. The more times price bounces off a level, the stronger that level becomes.
Should I draw support and resistance as lines or zones?
Always draw zones instead of exact lines. Markets don’t reverse at precise prices. Instead, they form areas where buying or selling pressure intensifies. A zone approach gives you flexibility and reflects real market behavior better than a single horizontal line. Most professional traders use zones spanning 10-30 pips depending on the timeframe.
How can I tell the difference between a real breakout and a false breakout?
Real breakouts show strong momentum with increased volume and a decisive close beyond the level. Price continues moving in the breakout direction without immediately returning. False breakouts briefly pierce the level but quickly reverse back, often on low volume. Wait for confirmation: a candle close beyond the level plus a successful retest of the broken level as new support or resistance.
Why does support become resistance and vice versa?
This role reversal happens because of trader psychology. When support breaks, traders who bought there realize they’re wrong and sell when price returns to that level, creating resistance. When resistance breaks, traders who sold there cover their positions when price returns, creating support. The level holds significance in traders’ memories, causing them to act when price revisits it.
What timeframe should I use for drawing support and resistance?
Higher timeframes like daily and weekly charts produce more reliable levels because they reflect larger market participation. However, use multiple timeframes: identify major levels on daily charts, then zoom to 4-hour and 1-hour charts for precise entry and exit points. Levels that align across multiple timeframes are the strongest and most likely to hold.
Can automated systems use support and resistance levels?
Yes. Many Expert Advisors and trading algorithms incorporate support and resistance logic. Automated systems can monitor multiple currency pairs simultaneously, detecting when price approaches key levels and executing trades based on programmed rules. Running these systems on a forex VPS ensures they operate 24/7 without interruption, catching opportunities across all trading sessions.
Conclusion: Mastering Support and Resistance Takes Practice
Support and resistance form the foundation of technical analysis in forex trading. Understanding these concepts gives you a framework for analyzing any currency pair on any timeframe.
The key points to remember:
- Support and resistance exist because of supply and demand dynamics, market psychology, and order clustering
- Identify levels using swing highs/lows, round numbers, historical points, and volume analysis
- Draw zones rather than exact lines to account for market reality
- Watch for role reversal when support becomes resistance and vice versa
- Wait for confirmation before entering trades at key levels
- Distinguish between real breakouts and false breakouts using volume, momentum, and price action
- Trade bounces in ranging markets, breakouts in trending markets, and retests for optimal risk/reward
- Avoid common mistakes like drawing too many lines, ignoring timeframe context, and fighting the trend
The best way to master support and resistance is through practice. Open your charts and start identifying levels. Paper trade or use a demo account to test bounce and breakout strategies. Track your results and refine your approach.
Over time, you’ll develop an intuition for which levels are strong and which are weak. You’ll recognize when a breakout is real and when it’s a trap. You’ll gain confidence in your analysis and improve your trading results.
Remember that even experienced traders don’t get every trade right. Support and resistance give you an edge, but they’re not magic. Combine them with proper risk management, realistic expectations, and continuous learning.
Whether you’re trading manually or using automated systems, support and resistance levels provide a logical, time-tested framework for making trading decisions in the dynamic forex market.

About the Author
Matthew Hinkle
Lead Writer & Full Time Retail Trader
Matthew is NYCServers' lead writer. In addition to being passionate about forex trading, he is also an active trader himself. Matt has advanced knowledge of useful indicators, trading systems, and analysis.