Prop Firm Daily Drawdown Rules: Never Breach Your Limits
Master prop firm daily drawdown rules with worked examples, lot sizing formulas, and dynamic risk frameworks. Covers balance vs equity and trailing vs static.

What Is Daily Drawdown and Why Prop Firms Enforce It
Daily drawdown is the maximum amount your account can lose in a single trading day before the firm pulls the plug. It’s not a suggestion. It’s a hard limit, and breaching it means instant failure on a challenge or losing your funded account outright.
Most prop firms set the daily drawdown between 4% and 5% of your starting balance or equity. That number sounds generous until you factor in spreads, commissions, and slippage on a volatile session. Suddenly, five percent shrinks fast.
Firms enforce daily drawdown for one reason: capital preservation. They’re backing you with real money (or at least real risk exposure), and they need guardrails. From the firm’s perspective, a trader who can’t manage a single bad day won’t survive long enough to generate consistent profits.
Understanding exactly how your firm calculates daily drawdown is the difference between surviving a rough session and watching your account get terminated at 3:47 PM on a Tuesday. Let’s break down every variation you’ll encounter.
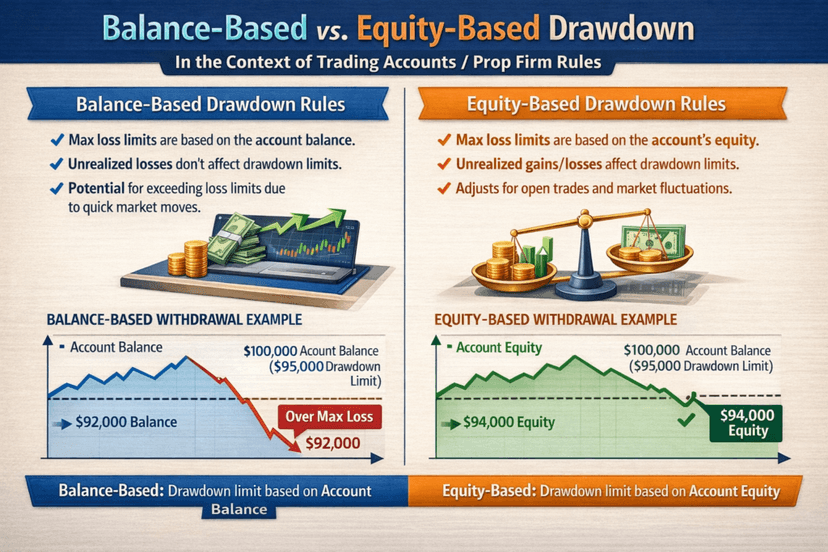
Balance-Based vs. Equity-Based Drawdown: The Calculation That Changes Everything
This is where most traders get caught. The daily drawdown calculation method varies by firm, and the difference is not trivial.
Balance-Based Daily Drawdown
Balance-based drawdown uses your account balance at the start of the trading day (typically midnight server time) as the reference point. Open trades don’t factor into the reset.
Example: You start the day with a $100,000 balance and a 5% daily drawdown rule. Your floor is $95,000. If your equity dips to $94,999 at any point during the day, you’ve breached, even if the trade recovers and closes in profit later.
Balance-based is more predictable. You know your exact threshold before the session begins. No surprises from overnight floating profits shifting the goalposts.
Equity-Based Daily Drawdown
Equity-based drawdown uses the higher of your starting balance or your highest equity point during the day. This is where things get dangerous.
Example: Same $100,000 account, 5% daily drawdown. You enter a trade that floats to +$3,000 in unrealized profit, pushing your equity to $103,000. Your new daily drawdown floor becomes $103,000 – $5,000 = $98,000. If you don’t lock in that profit and the trade reverses, you now need to stay above $98,000 instead of $95,000. Your effective tolerance just shrank from $5,000 to $2,000.
This is the equity trap. Floating profits raise the bar. If you let winners ride without taking partials, you’re tightening your own noose.
Side-by-Side Comparison
| Factor | Balance-Based | Equity-Based |
|---|---|---|
| Reference point | Start-of-day balance | Higher of balance or peak equity |
| Predictability | High – known before trading | Low – shifts during the day |
| Impact of floating profits | None | Raises the drawdown floor |
| Risk of accidental breach | Lower | Higher |
| Strategy adjustment needed | Minimal | Aggressive partial-taking required |
Always confirm which method your firm uses before you place your first trade. Read the fine print. This single detail has ended more funded accounts than bad strategy ever will.
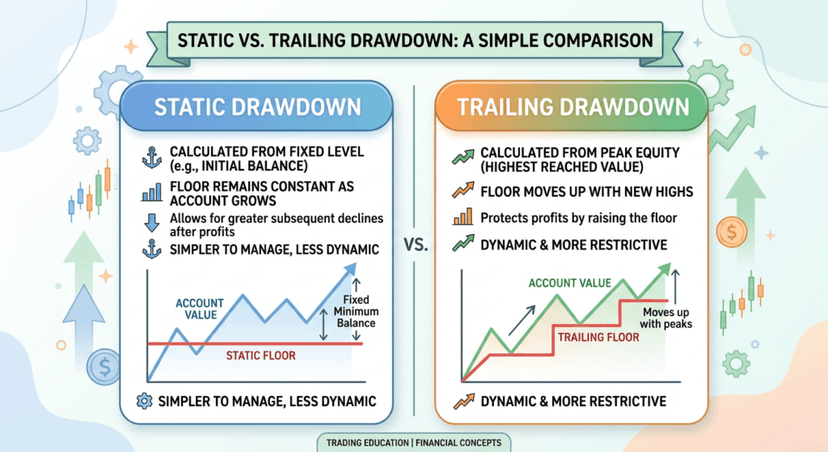
Static vs. Trailing Drawdown: How the Floor Moves
Daily drawdown is a per-day limit. But most prop firms also enforce an overall (maximum) drawdown, and this is where static versus trailing comes into play.
Static Drawdown
A static drawdown threshold is fixed from the start and never changes. If your $100,000 account has a 10% maximum drawdown, your absolute floor is $90,000 for the life of the account. Make $15,000 in profit? The floor stays at $90,000.
Static drawdown is trader-friendly. As you grow the account, the buffer between your current balance and the floor widens. This gives you more room to absorb losses on a bad week.
Trailing Drawdown
Trailing drawdown follows your highest achieved balance (or equity, depending on the firm). It locks in as your account grows, effectively reducing your total loss allowance.
Example: $100,000 account, 10% trailing drawdown. You grow the account to $108,000. The drawdown floor trails up to $97,200 ($108,000 – $10,800). If you then have a losing streak back to $100,000, your remaining buffer is only $2,800, not the original $10,000.
Some firms stop the trail once it reaches your initial balance. This means once your floor hits $100,000, it locks there permanently. Others trail indefinitely. The difference is enormous for your risk management.
How Static and Trailing Interact with Daily Limits
You can breach either limit independently. A trader with a 5% daily limit and a 10% trailing max might survive three bad days at -3% each (within daily limits) but fail the overall drawdown check on day three because the cumulative -9% approaches the trailing max. Always track both.
Intraday Trailing vs. End-of-Day: Same Trade, Different Outcome
This is the subtlety that separates traders who pass challenges from those who don’t. How the daily drawdown resets matters as much as the percentage itself.
Intraday Trailing Daily Drawdown
With intraday trailing, your daily drawdown floor moves upward in real time as your equity increases throughout the day. It never moves back down.
Let’s walk through a complete example on a $100,000 account with 5% daily drawdown:
| Time | Event | Equity | Daily Floor | Remaining Buffer |
|---|---|---|---|---|
| 00:00 | Day starts | $100,000 | $95,000 | $5,000 |
| 09:30 | Trade floats +$2,000 | $102,000 | $97,000 | $5,000 |
| 10:15 | Close for +$2,000 | $102,000 | $97,000 | $5,000 |
| 11:00 | New trade floats +$1,500 | $103,500 | $98,500 | $5,000 |
| 13:00 | Trade reverses to -$3,000 | $99,000 | $98,500 | $500 |
Notice what happened. You’re up $2,000 realized, sitting at a $1,000 unrealized loss on the second trade, and you’re only $500 away from breaching. The intraday trail turned a winning day into a near-death experience.
End-of-Day (EOD) Daily Drawdown
With EOD calculation, the daily drawdown floor is set at the start of day and doesn’t move until the next reset. Using the same scenario:
| Time | Event | Equity | Daily Floor | Remaining Buffer |
|---|---|---|---|---|
| 00:00 | Day starts | $100,000 | $95,000 | $5,000 |
| 09:30 | Trade floats +$2,000 | $102,000 | $95,000 | $7,000 |
| 10:15 | Close for +$2,000 | $102,000 | $95,000 | $7,000 |
| 11:00 | New trade floats +$1,500 | $103,500 | $95,000 | $8,500 |
| 13:00 | Trade reverses to -$3,000 | $99,000 | $95,000 | $4,000 |
Same trades, same outcomes, but the EOD model leaves you with $4,000 of breathing room instead of $500. That’s the difference between calmly managing the trade and panic-closing for a needless loss.
If you have a choice, always prefer firms with EOD-based daily drawdown. The intraday trailing model punishes winning trades that don’t go in a straight line.

The Math: How Many Trades Before You Breach
This is the calculation nobody else does. Knowing your maximum number of consecutive losers before you breach the daily drawdown tells you exactly how aggressive (or conservative) your position sizing needs to be.
The Formula
Maximum consecutive losers = Daily Drawdown Amount / Risk Per Trade
Simple, but powerful. Let’s build it out across three common account sizes with a 5% daily drawdown limit.
$50,000 Account
Daily drawdown limit: $2,500 (5% of $50,000)
| Risk Per Trade | Dollar Risk | Trades Before Breach | Verdict |
|---|---|---|---|
| 2.0% | $1,000 | 2.5 (effectively 2) | Extremely dangerous |
| 1.0% | $500 | 5 | Tight but workable |
| 0.5% | $250 | 10 | Comfortable |
| 0.25% | $125 | 20 | Very safe |
$100,000 Account
Daily drawdown limit: $5,000 (5% of $100,000)
| Risk Per Trade | Dollar Risk | Trades Before Breach | Verdict |
|---|---|---|---|
| 2.0% | $2,000 | 2.5 (effectively 2) | Extremely dangerous |
| 1.0% | $1,000 | 5 | Tight but workable |
| 0.5% | $500 | 10 | Comfortable |
| 0.25% | $250 | 20 | Very safe |
$200,000 Account
Daily drawdown limit: $10,000 (5% of $200,000)
| Risk Per Trade | Dollar Risk | Trades Before Breach | Verdict |
|---|---|---|---|
| 2.0% | $4,000 | 2.5 (effectively 2) | Extremely dangerous |
| 1.0% | $2,000 | 5 | Tight but workable |
| 0.5% | $1,000 | 10 | Comfortable |
| 0.25% | $500 | 20 | Very safe |
The pattern is clear. At 1% risk per trade, you get exactly five shots before you’re done. That might sound like enough until you’re in a choppy market and your first three scalps all stop out. Suddenly you’re at -3%, and you need to either stop trading or drop your risk to avoid the breach.
Lot Sizing Formula
Once you know your dollar risk per trade, convert it to lot size:
Lot Size = Dollar Risk / (Stop Loss in Pips x Pip Value)
Example: $100,000 account, 0.5% risk ($500), 20-pip stop loss on EUR/USD (pip value = $10 per standard lot).
Lot Size = $500 / (20 x $10) = $500 / $200 = 2.5 standard lots.
If you widen the stop to 40 pips: $500 / (40 x $10) = 1.25 lots. The wider your stop, the smaller your position. This isn’t optional math when you’re protecting a funded account.
Run this calculation before every single trade. Not after. Not approximately. Exactly.
Dynamic Risk Reduction: Scaling Down Before It’s Too Late
Fixed risk per trade is a starting point, not a complete plan. Smart funded traders use a dynamic framework that reduces risk as losses accumulate during the day.
The Three-Tier Framework
Here’s a practical system for a $100,000 account with a 5% ($5,000) daily drawdown limit:
| Daily P&L Zone | Drawdown Used | Risk Per Trade | Max Lot Size (20-pip SL, EUR/USD) | Action |
|---|---|---|---|---|
| Green: $0 to -$1,500 | 0-30% | 0.5% ($500) | 2.5 lots | Trade normally |
| Yellow: -$1,500 to -$3,000 | 30-60% | 0.25% ($250) | 1.25 lots | Reduce size, high-conviction only |
| Red: -$3,000 to -$4,000 | 60-80% | 0.1% ($100) | 0.5 lots | One final attempt or stop |
| Stop: Beyond -$4,000 | 80%+ | 0% | 0 lots | Walk away. Done for the day. |
Why 80% and Not 100%?
You stop at 80% of your daily limit, not 100%. The remaining $1,000 is your slippage and spread buffer. If you’re trading during news events or in thin liquidity, your actual loss on a “40-pip stop” might be 45 or 50 pips due to slippage. That extra margin keeps you alive.
Adapting for Smaller Accounts
On a $50,000 account, the same framework applies but the dollar amounts halve. Your green zone risk is $250 per trade, yellow drops to $125, and red goes to $50. At $50 risk per trade, you’re looking at micro lots. That’s fine. A micro lot that keeps you funded beats a standard lot that gets you terminated.
The discipline to scale down mid-session separates traders who pass challenges from those who reset three times and blame the market.

How Slippage Eats Your Drawdown Buffer
Slippage is the gap between where you set your stop loss and where it actually fills. On a normal day, it might be 0.5 to 1 pip. During NFP, FOMC, or flash crashes, slippage can blow through 5, 10, or even 20 pips past your stop.
The Hidden Cost in Dollar Terms
Let’s quantify slippage impact on a $100,000 account running 2.0 standard lots:
| Slippage Amount | Extra Loss Per Trade | Over 5 Trades | % of Daily Drawdown ($5,000) |
|---|---|---|---|
| 1 pip | $20 | $100 | 2% |
| 3 pips | $60 | $300 | 6% |
| 5 pips | $100 | $500 | 10% |
| 10 pips | $200 | $1,000 | 20% |
At 10 pips of slippage across five trades, you’ve lost one-fifth of your daily drawdown to execution alone. That’s before you even count whether your strategy is profitable.
Where Your Execution Environment Matters
Slippage has two components: market conditions (which you can’t control) and execution latency (which you can). When your stop loss gets triggered, the speed at which that order reaches the broker’s server directly affects your fill price.
A home internet connection pinging at 80-120ms to your broker adds measurable delay. In fast-moving markets, that delay translates directly into worse fills. A VPS located in the same data center as your broker’s servers cuts that latency to under 1ms.
For prop firm traders specifically, the math is straightforward. If a VPS saves you an average of 1-2 pips per stop-out on slippage, and you hit 3-5 stops per day on a losing session, that’s $60 to $200 saved on a 2-lot position. Over a month of trading, that margin can be the difference between staying within drawdown limits and getting breached on a day you should have survived.
Check our forex VPS plans to ensure your trading setup never misses a beat.
Practical Slippage Mitigation Checklist
- Run your platform on a VPS co-located with your broker’s servers
- Avoid holding positions through high-impact news unless your strategy specifically requires it
- Use limit orders for entries where possible (no slippage on limits)
- Factor 1-2 pips of slippage into every stop loss calculation as a buffer
- Test your actual slippage by comparing intended versus filled prices over 50+ trades
- Reduce position size during known low-liquidity windows (rollover, session opens)
Prop Firm Drawdown Rules Compared
Every firm structures drawdown differently. Here’s a breakdown of the major firms and their specific rules as of 2026. Always verify directly with the firm, as rules change.
| Firm | Daily Drawdown | Max Drawdown | Daily DD Type | Max DD Type | DD Reset Time |
|---|---|---|---|---|---|
| FTMO | 5% | 10% | Equity-based (relative to start-of-day balance or equity, whichever is higher) | Static | Midnight CE(S)T |
| FundedNext | 5% | 10% | Equity-based | Static (Evaluation) / Trailing (Express) | Midnight server time |
| The5ers | 3-5% (varies by program) | 6-10% (varies by program) | Balance-based | Static | Midnight server time |
| FXIFY | 5% | 10% | Equity-based | Static or Trailing (depending on plan) | Midnight server time |
| FundingPips | 4-5% | 8-10% | Equity-based | Static | Midnight server time |
Key Takeaways from the Comparison
- The5ers stands out with balance-based daily drawdown, which is more forgiving than equity-based. However, their tighter 3% daily limit on some programs offsets that advantage.
- FTMO uses equity-based daily drawdown that recalculates if your equity exceeds your starting balance during the day. This is the intraday trailing model discussed above.
- FundedNext Express uses trailing max drawdown, meaning your profit cushion shrinks as you grow the account. Their evaluation model is more forgiving with static max DD.
- FundingPips offers slightly tighter daily limits on some programs (4% vs 5%), so adjust your risk framework accordingly.
Before selecting a firm, map their drawdown rules to your trading style. Scalpers who take many small trades per day need more margin for consecutive losers and should prioritize higher daily drawdown percentages. Swing traders who hold one or two positions might focus more on max drawdown type (static preferred).

Building Your Daily Drawdown Protection Plan
Theory is useless without a plan you’ll actually follow. Here’s a step-by-step framework you can apply to any prop firm account starting today.
Step 1: Know Your Numbers
Before the trading week starts, write down these three figures:
- Daily drawdown dollar amount (e.g., $5,000 on a $100K account with 5%)
- Maximum risk per trade in the green zone (e.g., $500 at 0.5%)
- Your walk-away threshold (e.g., -$4,000 or 80% of daily limit)
Step 2: Set Alerts, Not Mental Notes
Configure platform alerts at 30%, 60%, and 80% of your daily drawdown. Mental notes fail under pressure. Automated alerts don’t. Most prop firm dashboards show real-time drawdown tracking, but having your own alerts on the platform adds redundancy.
Step 3: Pre-Calculate Lot Sizes
Build a cheat sheet for your common setups. If you typically trade EUR/USD and GBP/USD with 15, 20, and 30-pip stops, pre-calculate the lot size for each scenario at each risk tier. Tape it to your monitor. Decision fatigue during a drawdown spiral is real, and doing math under stress leads to mistakes.
Step 4: Use the 80% Rule Religiously
Never consume more than 80% of your daily drawdown. The remaining 20% is your insurance against slippage, spread widening, and the cost of closing remaining positions. Walking away at -$4,000 when your limit is $5,000 feels frustrating in the moment. Getting terminated because you pushed to -$4,800 and slippage took the rest feels worse.
Step 5: Review and Adjust Weekly
At the end of each week, review your actual drawdown usage. If you’re consistently hitting the yellow zone (30-60%), your position sizing or trade frequency needs adjustment. If you never leave the green zone, you might be leaving profit on the table. Find the balance.
Frequently Asked Questions
What happens if I breach the daily drawdown on a prop firm account?
Breaching the daily drawdown typically results in immediate account termination during a challenge phase or loss of your funded account. Most firms close all open positions automatically once the threshold is hit. You’ll need to purchase a new challenge to start over. Some firms offer free retries or discounted resets, but the original account is gone.
Does daily drawdown reset every day?
Yes. The daily drawdown resets at a specific time each day, usually midnight server time (often CE(S)T or EST depending on the firm). At reset, your new daily drawdown floor recalculates based on your current balance or equity. This means a fresh trading day gives you a fresh daily limit, regardless of what happened the day before.
Is daily drawdown calculated on balance or equity?
It depends on the firm. Most major prop firms use equity-based daily drawdown, meaning unrealized floating profits can raise your drawdown floor during the day. Some firms like The5ers use balance-based calculation, which only considers realized profits and losses. Always check your firm’s specific rules before trading.
What is the difference between daily drawdown and maximum drawdown?
Daily drawdown limits how much you can lose in a single trading day (typically 4-5%). Maximum drawdown limits your total loss from the starting balance over the life of the account (typically 8-12%). You can breach either limit independently. A trader might pass the daily drawdown check every day but still fail the max drawdown after accumulating several losing days.
How do I calculate the right lot size for my prop firm drawdown limit?
Use this formula: Lot Size = (Account Balance x Risk Percentage) / (Stop Loss in Pips x Pip Value). For a $100,000 account risking 0.5% with a 25-pip stop on EUR/USD: Lot Size = ($100,000 x 0.005) / (25 x $10) = $500 / $250 = 2.0 standard lots. Adjust the risk percentage based on which zone you’re in (green, yellow, red) from the dynamic framework above.
Can slippage cause me to breach my daily drawdown even with proper stop losses?
Yes. Stop losses are not guaranteed fills. During high-volatility events like NFP or rate decisions, slippage can push your actual loss well beyond your intended stop level. This is why the 80% rule exists: never use more than 80% of your daily drawdown allowance, keeping 20% as a buffer for execution costs and slippage. Running your platform on a low-latency VPS also reduces slippage by minimizing the time between stop trigger and order execution.
Should I choose a prop firm with static or trailing drawdown?
Static drawdown is almost always preferable. With static drawdown, your floor stays fixed at the original level, meaning every dollar of profit adds to your safety buffer. Trailing drawdown follows your highest balance, so profits don’t increase your margin of safety. If you’re a consistent but imperfect trader who occasionally gives back gains, trailing drawdown will punish you much harder than static. Choose trailing only if the firm offers significantly better profit splits or other terms that justify the extra risk.

About the Author
Thomas Vasilyev
Writer & Full Time EA Developer
Tom is our associate writer, and has advanced knowledge with the technical side of things, like VPS management. Additionally Tom is a coder, and develops EAs and algorithms.