

Ichimoku Cloud in Forex Trading: Complete Strategy Guide
Learn how the Ichimoku Cloud works in forex trading: its five lines, best settings, TK crosses, Kumo breakouts, and a practical strategy for traders.

What Is the Ichimoku Cloud?
The Ichimoku Cloud is an all-in-one technical indicator that shows trend direction, momentum, and potential support and resistance on one chart. The quick verdict: it is most useful as a trend filter and confirmation system, not as a standalone signal generator. If price, the cloud, the Tenkan-sen, Kijun-sen, and Chikou span agree, you have a stronger setup than a single crossover alone.
In forex trading, that one-glance view helps you answer three practical questions: Is the pair trending? Is momentum aligned with that trend? Is price approaching a zone that could stop or reverse the move? The trade-off is a busy-looking chart and signals that can lag or whipsaw when the market ranges.
The indicator’s full name is Ichimoku Kinko Hyo, often translated as “one glance equilibrium chart” or “one glance balance chart.” Japanese journalist Goichi Hosoda, who wrote under the pen name Ichimoku Sanjin, began developing it in the late 1930s. After roughly 30 years of refinement, he published the system to the public in the late 1960s.
Unlike an indicator that measures only momentum or volatility, Ichimoku organizes several time horizons into a single framework. Two lines track short- and medium-term price balance, two leading spans form the Kumo cloud, and one lagging span compares current price with earlier price action.
The Five Ichimoku Lines Explained
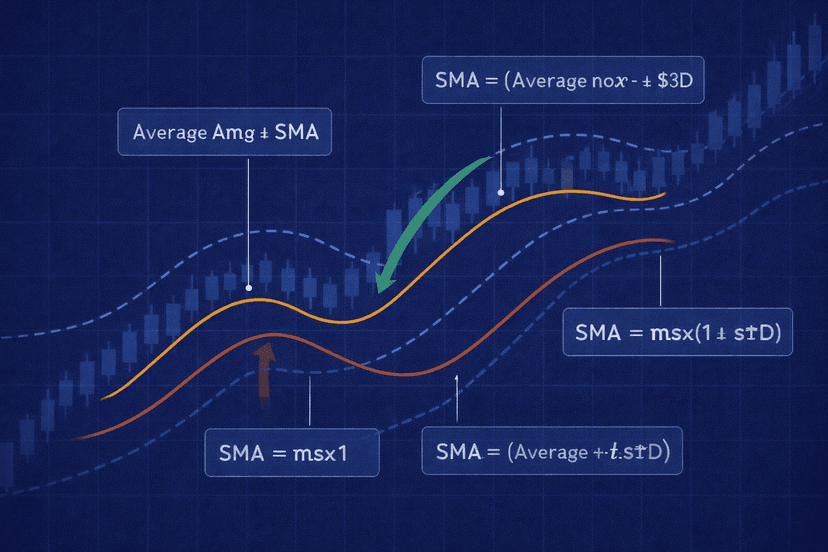
Ichimoku calculations use the midpoint of each period’s highest high and lowest low rather than a conventional average of closing prices. That distinction matters: each line describes the center of a recent price range. The five components work together as follows.
| Component | Formula and plot | Primary role |
|---|---|---|
| Tenkan-sen | (9-period high + 9-period low) / 2 | Short-term momentum and signal line |
| Kijun-sen | (26-period high + 26-period low) / 2 | Medium-term trend, support/resistance, and trailing-stop reference |
| Senkou Span A | (Tenkan-sen + Kijun-sen) / 2, plotted 26 periods ahead | One edge of the Kumo cloud |
| Senkou Span B | (52-period high + 52-period low) / 2, plotted 26 periods ahead | The other edge of the Kumo cloud |
| Chikou span | Current closing price plotted 26 periods back | Momentum confirmation against earlier price |
Tenkan-sen and Kijun-sen
The Tenkan-sen, or Conversion Line, responds to the nine-period range and represents short-term momentum. It moves faster than the Kijun-sen, so traders watch whether it crosses above or below the slower line.
The Kijun-sen, or Base Line, uses the 26-period range. It represents the medium-term trend and can act as dynamic support or resistance. Because it reacts more slowly, it can also provide a reference for trailing a stop, although it should not replace a predefined risk plan.
Senkou Spans and the Kumo Cloud
Senkou Span A averages the Tenkan-sen and Kijun-sen, while Senkou Span B uses the midpoint of the 52-period range. Both are shifted 26 periods forward. The shaded area between them is the Kumo cloud, typically shown as green and bullish when Span A is above Span B, or red and bearish when Span B is above Span A.
Chikou Span
The Chikou span is today’s closing price shifted 26 periods backward. It does not predict the next 26 periods. Instead, it lets you compare current price with price action 26 periods ago: above that earlier price supports bullish momentum, while below it supports bearish momentum.
Ichimoku Settings: How 9, 26, and 52 Work
The default Ichimoku settings are 9, 26, and 52. They reflect the historical Japanese six-day trading week: nine periods for the fast line, 26 for the base line and plot shift, and 52 for the slower cloud boundary. The history explains the defaults, but it does not make them mandatory for modern forex markets.
Start with 9/26/52 because it gives you a common baseline and makes chart reading consistent. Alternatives such as 10/30/60 or 20/60/120 slow the indicator down and may suit traders who want to filter more short-term noise. Any change alters the strategy, so test it on the same pairs and timeframes you intend to trade.
Shorter lookback settings react faster and produce more signals, but they also increase false-signal and whipsaw risk. Longer settings react more slowly and produce fewer setups. Avoid choosing a configuration only because it fits one historical chart; the goal is a rule set that remains usable across different market conditions.
How to Read the Cloud for Trend, Momentum, and Support
Begin with price’s location relative to the Kumo. Price above the cloud indicates an uptrend, price below it indicates a downtrend, and price inside it signals a neutral or choppy market. When price is inside, the indicator offers less directional clarity, so waiting for a confirmed exit is usually more disciplined than forcing a trade.
- Bullish structure: Price is above the cloud, ideally with Span A above Span B.
- Bearish structure: Price is below the cloud, ideally with Span B above Span A.
- Neutral structure: Price is inside the cloud, where signals are more likely to conflict.
Cloud thickness adds context. A thick Kumo represents a broader support or resistance area and is generally harder for price to break. A thin cloud offers less of a barrier. This does not guarantee that a thick cloud will hold; it simply tells you how substantial the projected zone is.
A Kumo twist occurs when Senkou Span A and Span B cross, changing the cloud’s color. It can hint at a possible reversal as the underlying balance shifts, but a twist by itself is not an entry signal. Check where price sits, whether momentum agrees, and whether the market is trending before acting.
Finally, read the Tenkan-sen and Kijun-sen as momentum within that structure. Tenkan above Kijun favors bullish momentum; Tenkan below Kijun favors bearish momentum. A crossover aligned with price’s cloud position carries more weight than one that fights the larger trend.
A Practical Ichimoku Forex Trading Strategy
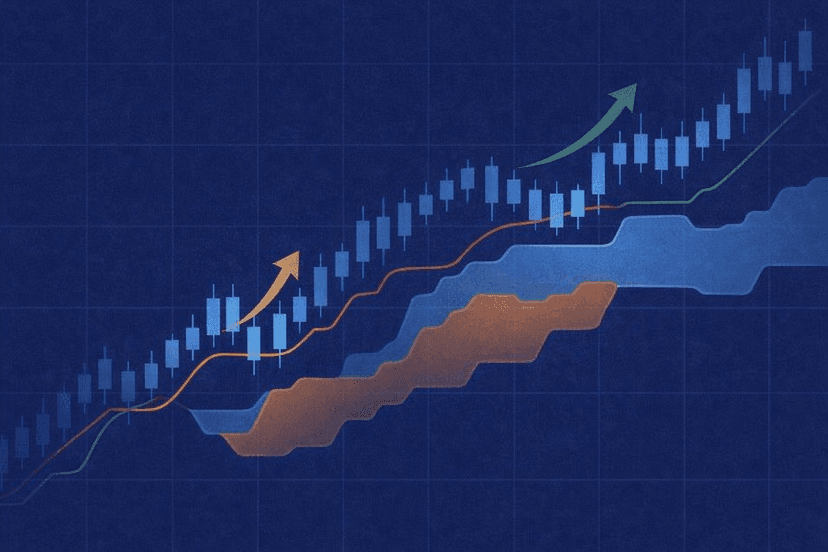
A practical Ichimoku forex strategy uses several filters instead of treating every TK cross as a trade. The objective is alignment: price confirms the trend, the cloud shows a viable path, and the Chikou span confirms that current momentum is stronger than earlier price action.
Step 1: Establish Direction with the Kumo
For a long setup, require price above the cloud. For a short setup, require price below it. Skip new entries while price is inside the Kumo, because that is the condition in which trend and support/resistance signals are least clear.
Step 2: Check Cloud Strength and the TK Cross
For a bullish setup, look for Tenkan-sen to cross above Kijun-sen while price is above the cloud. For a bearish setup, look for Tenkan-sen to cross below Kijun-sen while price is below it. Crosses above the Kumo are stronger bullish signals, and crosses below it are stronger bearish signals; crosses inside the cloud are weak.
You can also use a Kumo breakout as the trigger. A bullish breakout occurs when price moves from within or below the cloud and closes above it; a bearish breakout closes below it. Check cloud thickness before entry because a thin section may break more easily but can also offer less evidence of a durable trend transition.
Step 3: Confirm with the Chikou Span
Confirm a long setup when the Chikou span is above price from 26 periods earlier. Confirm a short setup when it is below that earlier price. If the Chikou span conflicts with the proposed direction, wait rather than reducing a three-filter process to a single crossover.
Use this trade checklist before placing an order:
- Price is clearly above the cloud for a long or below it for a short.
- The cloud’s direction and thickness do not contradict the trade.
- The TK cross is aligned with price’s position relative to the Kumo.
- The Chikou span confirms momentum against price 26 periods earlier.
- A stop-loss, position size, and exit rule are defined before entry.
Apply the rules first on a demo account and document every setup. Ichimoku was originally designed for weekly charts, and its signals are commonly considered most reliable on daily and weekly timeframes. Faster charts can generate more opportunities, but they also expose the system to more noise.
Limitations and Best Practices
Ichimoku is a lagging, trend-following system. It organizes past and current price information; it does not guarantee where price will go next. Its main weakness appears in sideways conditions, especially low-volume or highly volatile ranges where repeated cloud entries and TK crosses can produce whipsaws.
- Avoid low-quality conditions: Treat price inside the cloud as a reason to wait, not a reason to guess.
- Favor clear trends: The framework works best when a pair is moving directionally, especially on daily or weekly charts.
- Add independent confirmation: RSI can help assess momentum, while available volume data can help judge participation.
- Keep risk separate from the signal: A strong Ichimoku setup can still fail, so use a stop-loss and controlled position size.
- Test automated rules: If an EA uses TK crosses or Kumo breakouts, verify the exact settings, candle-close logic, and risk rules before live use.
An Ichimoku-based EA also needs to stay connected while the forex market operates 24 hours a day, five days a week. Running it on a reliable, always-on Forex VPS can keep the platform active when your home computer is off or disconnected. That improves operational continuity, but it cannot improve a weak strategy or remove market risk.
Conclusion
Ichimoku becomes manageable once you stop viewing it as five unrelated lines. First read price versus the Kumo, then check the cloud’s structure, the TK cross, and the Chikou span. That sequence turns a crowded chart into a repeatable trend-following process.
Start with 9/26/52 on daily or weekly charts, avoid entries inside the cloud, and require multiple components to agree. Combine that discipline with independent confirmation and defined risk. The indicator will not eliminate losing trades, but it can help you reject weak setups and act consistently when trend and momentum align.
Frequently Asked Questions
What does the Ichimoku Cloud tell forex traders?
It shows trend direction, momentum, and potential support and resistance in one view. Price above the Kumo suggests an uptrend, price below it suggests a downtrend, and price inside it suggests neutral or choppy conditions.
What are the best Ichimoku settings for forex?
The standard starting point is 9/26/52. Alternatives such as 10/30/60 and 20/60/120 are slower. Shorter settings react faster but raise whipsaw risk, so test any variation on your intended pair and timeframe rather than assuming it is better.
What is a bullish TK cross?
A bullish TK cross occurs when the Tenkan-sen crosses above the Kijun-sen. It is considered more reliable when the cross occurs above the cloud. A bearish TK cross is the opposite and carries more weight below the cloud.
Is the Chikou span plotted forward or backward?
The Chikou span is the current closing price plotted 26 periods backward. Senkou Span A and Senkou Span B are the components plotted 26 periods forward to create the cloud.
Can you use the Ichimoku Cloud by itself?
You can use its components as a complete trend framework, but you should not treat it as a guarantee or ignore risk management. Confirmation from RSI or available volume data, plus a stop-loss and position-sizing rule, can help you filter weak signals and control losses.

About the author
Thomas Vasilyev
Writer & Full Time EA Developer
Tom is our associate writer, and has advanced knowledge with the technical side of things, like VPS management. Additionally Tom is a coder, and develops EAs and algorithms.
Areas of Expertise