
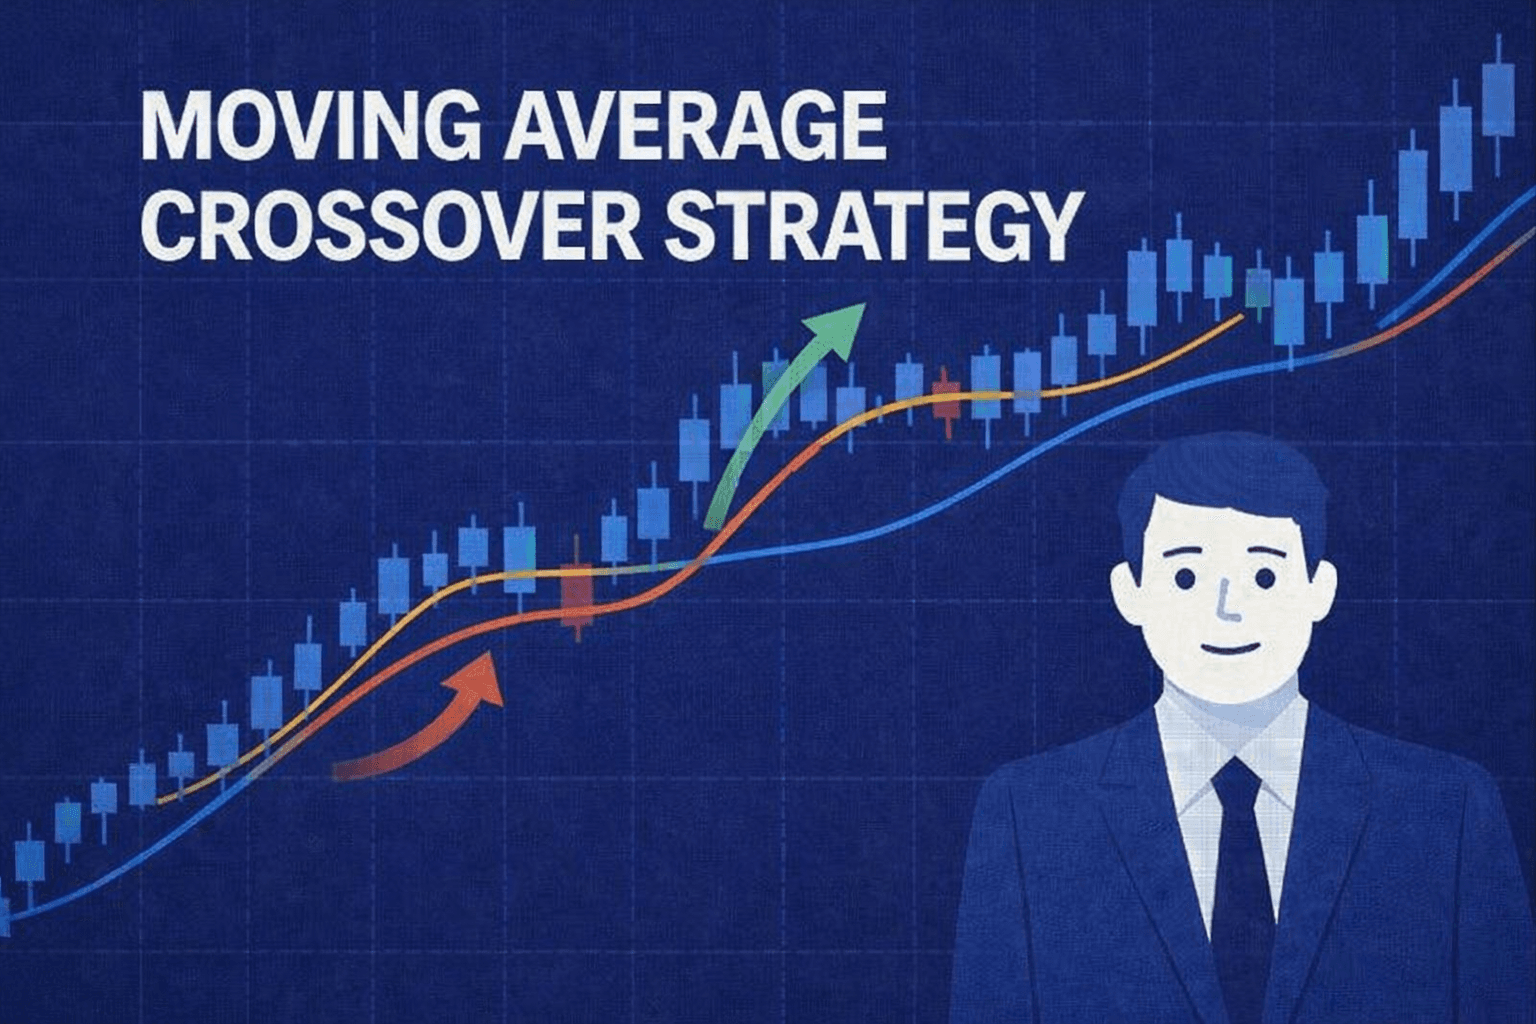
Moving Average Crossover Strategy: A Practical Forex Guide
Learn how a moving average crossover strategy works in forex, including golden and death crosses, EMA vs SMA, practical settings, and false-signal filters.
A moving average crossover strategy uses a fast moving average crossing a slower one to confirm that a forex trend may be changing. A cross above is bullish; a cross below is bearish. The signal is simple enough to trade manually or code into an EA, but it works best when you filter for trend strength instead of taking every cross.
The catch is lag. Both lines are calculated from past prices, so a crossover confirms movement that has already started rather than predicting the next move. Treat it as a trend-following framework, not a stand-alone buy or sell command.
What Is a Moving Average Crossover Strategy?
A moving average smooths a series of prices into one line. Because it trails price and reduces short-term noise, it is a lagging indicator. Moving averages also form part of other tools, including Bollinger Bands and MACD.
A crossover setup puts two moving averages on the same chart. The fast average uses fewer periods and reacts sooner; the slow average covers more periods and changes more gradually. When the fast line moves above the slow line, the setup produces a bullish signal. When it moves below, the signal is bearish.
The familiar names are the golden cross for a bullish crossover and the death cross for a bearish one. Those terms classically describe the 50-day and 200-day averages on stocks and indices. On an intraday forex chart, it is more accurate to say 50-period and 200-period because each period could be a minute, an hour, or another chart interval.
The signal does not tell you how far price will travel or whether a trend will persist. It only tells you that the shorter price average has moved from one side of the longer average to the other. Your market-regime filter, stop placement, and exit rules still decide whether the setup is tradable.
Moving Average Basics: SMA vs EMA vs WMA
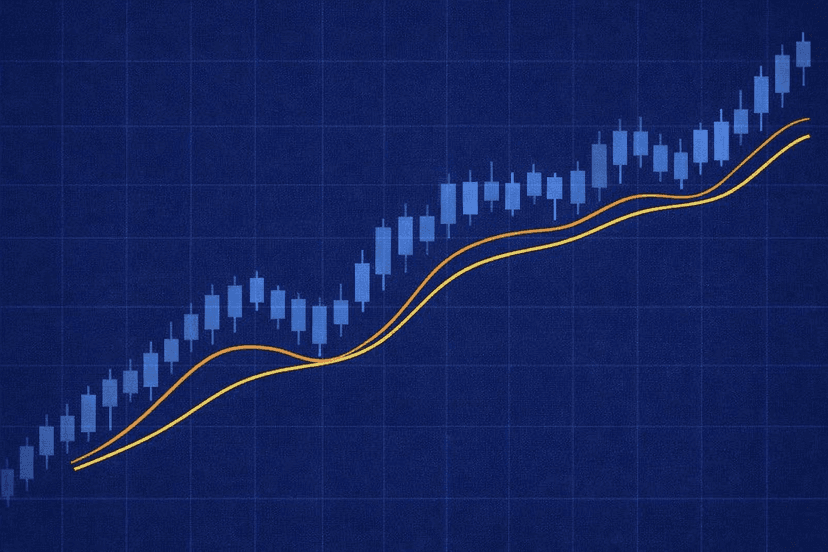
The moving-average type controls how much influence each price receives. The simple moving average gives every observation equal weight, while exponential and weighted moving averages emphasize newer data. That difference changes signal speed and sensitivity.
Simple Moving Average (SMA)
The SMA formula is SMA = (A1 + A2 + … + An) / n. Add the prices in the chosen window, then divide by the number of observations. A 20-period SMA therefore assigns the same weight to the oldest and newest price in that 20-period window.
This equal weighting creates a smoother, slower line. An SMA can provide a cleaner long-term trend reference and a steadier area of dynamic support or resistance, but it will usually turn later than a faster-weighted average.
Exponential Moving Average (EMA)
An EMA gives more weight to recent prices. Its smoothing multiplier is 2 / (period + 1). That makes the multiplier about 18.18% for a 10-period EMA and about 9.52% for a 20-period EMA.
Because recent data has more influence, an EMA reacts faster and has less lag than an SMA using the same period. The trade-off is sensitivity: an EMA can cross earlier, but it can also react more aggressively to short-lived price movement.
Weighted Moving Average (WMA)
A WMA assigns a descending multiplier across the lookback window, with the newest observation receiving the highest weight. It provides another responsive alternative when you want recent price action to matter more than older data.
| Type | Weighting | Relative lag | Practical use |
|---|---|---|---|
| SMA | Equal weight for every period | More | Smoother trend reference and longer-term levels |
| EMA | More weight on recent prices | Less than SMA | Faster crossover entries and active trading |
| WMA | Descending weights, newest highest | Responsive | Recent-price emphasis with explicit weighting |
None is universally best. An EMA vs SMA crossover may give earlier entries than an all-SMA setup, while two SMAs may produce a steadier signal. Test the type, pair, timeframe, and execution rules together rather than choosing by speed alone.
Golden Cross and Death Cross Explained
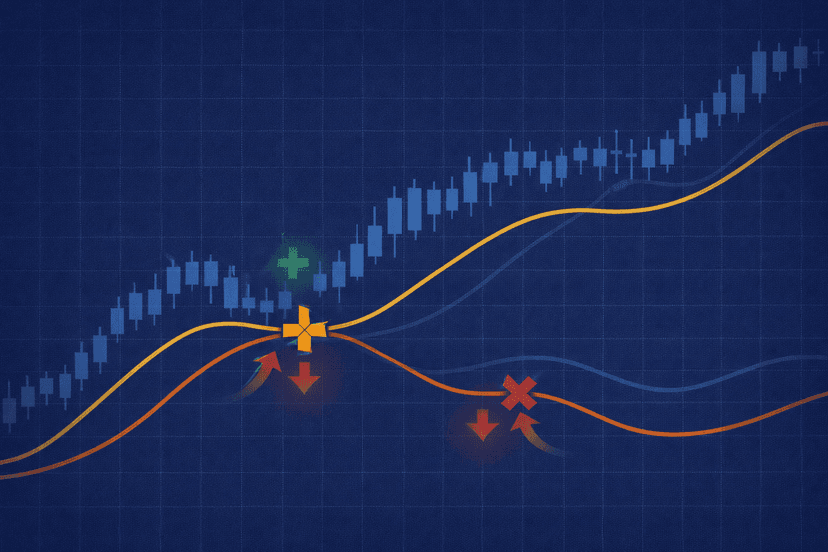
The classic golden cross occurs when the 50-day moving average rises above the 200-day moving average. It is read as bullish because the shorter-term average has overtaken the long-term baseline. A death cross is the inverse: the 50-day average falls below the 200-day average, creating a bearish signal.
The Corporate Finance Institute breaks a golden cross into three stages. First, an existing downtrend loses force as buying begins to overpower selling. Second, the short moving average crosses above the long moving average. Third, a prolonged uptrend may develop, with both averages potentially acting as support.
That sequence highlights why the cross is confirmation rather than prediction. Price can turn well before the averages meet, so the signal may arrive after a meaningful part of the move. Some traders also view the golden cross as partly self-fulfilling because so many market participants monitor it, but recognition does not make it reliable in every market.
For forex, keep the logic and adapt the periods. A 50/200 pair on a four-hour chart is still a 50/200 crossover, but it is not the same horizon as the traditional daily-market signal. Always state the chart timeframe when discussing or testing results.
Choosing Your Moving Average Crossover Settings
Your settings determine the balance between speed and noise. TradingView groups moving-average lengths under 20 periods as short term, 20 to 60 as medium term, and more than 60 as long term. As the lookback grows, the line becomes slower and adds more lag.
Use the following pairs as starting templates, not promises:
- 5/20 for scalping: The fast pair reacts quickly and creates more signals, but it also produces more noise and demands strict spread, execution, and regime filters.
- 20/50 for swing trading: This medium-speed pair sacrifices some entry speed for a smoother view of a developing trend.
- 50/200 for position trading: The classic pair focuses on broad direction, creates fewer signals, and reacts much later than shorter combinations.
The same settings behave differently across EUR/USD, GBP/JPY, and other pairs because their volatility and trend behavior differ. They also behave differently on five-minute and daily charts. Backtest each combination across trending and ranging samples, then forward-test it under realistic spreads before committing capital.
Do not optimize only for the most profitable historical values. If changing 20/50 to 19/48 transforms the result, the apparent edge may be too fragile. A useful configuration should tolerate small parameter changes and still follow the same trading logic.
Trading the Crossover: Entries, Exits, and the Price Filter
The simplest entry is to act when the fast average closes across the slow average. A bullish close can trigger a long entry; a bearish close can trigger a short. Waiting for the candle to close avoids reacting to an intrabar cross that disappears before the period ends, although it also makes the entry later.
A price crossover adds another layer. In a bullish setup, price crosses above the fast average while the fast average is already above the slow average. The slow average confirms the broader trend, and price supplies the entry trigger. For a bearish setup, price crosses below the fast average while the fast average remains below the slow average.
A practical workflow looks like this:
- Define direction. Only consider longs when the fast average is above the slow average and shorts when it is below.
- Wait for the trigger. Use either a completed MA cross or a price crossover aligned with the existing MA structure.
- Map invalidation. Place the stop beyond a logical swing or beyond the moving-average area acting as dynamic support or resistance, rather than at an arbitrary distance.
- Set the exit rule first. Possible rule sets include exiting on an opposite cross, trailing behind the slower average, or taking profit at a predefined price level.
- Size from the stop. Calculate position size after choosing the invalidation point so the amount at risk remains controlled.
Moving averages are zones, not exact barriers. Price can probe through a line and recover, so stops placed directly on the average are vulnerable to routine movement. Use market structure to decide where the trade idea is actually wrong.
The Whipsaw Problem: Filtering False Crossover Signals
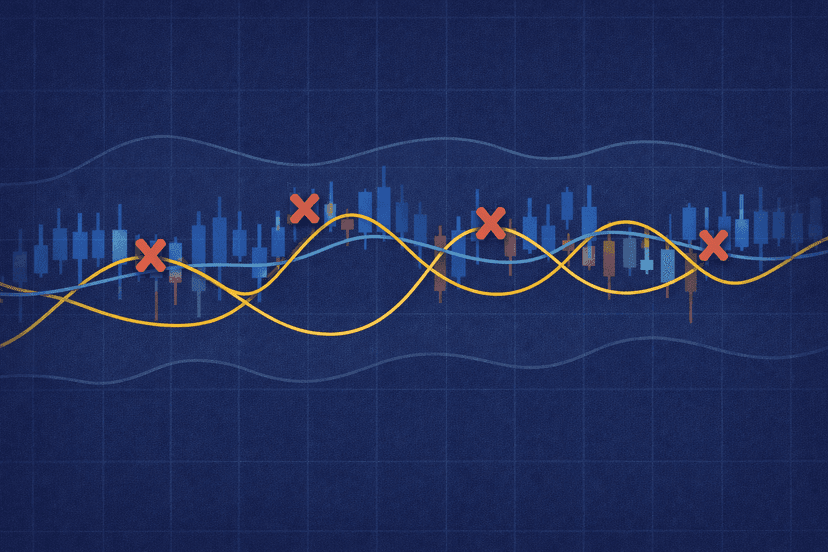
Crossovers work best when price sustains a strong trend. In a range, the fast and slow lines flatten, converge, and repeatedly trade places. Each new signal can arrive near the edge of the range just before price reverses again. That sequence of small losses is the whipsaw problem.
The root issue is structural: a crossover system combines two lagging indicators. Changing from SMA to EMA can make the response faster, but it cannot turn past-price calculations into a forecast. You need filters that help separate directional conditions from chop.
- Momentum or trend strength: Require supporting evidence from ADX, RSI, or MACD instead of accepting the cross by itself. A filter should agree with the direction and show that movement has enough force to justify an entry.
- Higher timeframe alignment: Take lower-timeframe longs only when the higher-timeframe MA structure is bullish, and apply the inverse rule to shorts. This removes countertrend signals but will reduce trade frequency.
- Price action: Look for a forex breakout, a higher high and higher low in an uptrend, or a lower low and lower high in a downtrend. If price remains trapped between obvious boundaries, skip the cross.
- MA slope and separation: Flat, intertwined averages indicate indecision. Lines that slope and separate in one direction provide a cleaner trend context.
These filters do not eliminate losing trades. They deliberately reject marginal setups, which means you will also miss some valid moves. Judge a filter by its effect on the complete system—signal quality, trade frequency, risk, and execution—not by whether it improves one chart example.
Automation can make those rules more consistent. An EA can calculate the same crossover, timeframe alignment, and exit conditions on every tick without taking an impulsive trade after a loss. Running it continuously on a forex VPS also avoids relying on an unattended home computer, but hosting cannot repair weak logic. Backtest the exact rules, include trading costs, and monitor live behavior.
Conclusion: Use Crossovers as a Trend-Following Backbone
A moving average crossover gives you an objective way to define trend direction and trigger entries. EMA setups react faster, SMA setups are smoother, and 5/20, 20/50, and 50/200 pairs cover progressively longer horizons. None is automatically the best choice.
The edge comes from context. Trade crossovers when the market is moving directionally, demand confirmation, and define the exit before entry. In a range, the same clean-looking rules can become a whipsaw machine. Used with regime filters and disciplined risk control, crossovers can serve as a practical backbone for manual or automated forex trend following.
Moving Average Crossover FAQ
What is the best moving average crossover for forex?
There is no universal best pair. A 5/20 combination favors speed, 20/50 balances responsiveness and smoothing, and 50/200 tracks broader trends. The right choice depends on your pair, timeframe, costs, and tolerance for false signals, so compare settings with backtests and forward tests.
Is an EMA crossover better than an SMA crossover?
An EMA crossover reacts sooner because recent prices receive more weight. That can help you enter a developing move earlier, but it also increases sensitivity to noise. An SMA crossover is slower and smoother. “Better” depends on whether your tested strategy benefits more from speed or signal stability.
What do the golden cross and death cross mean?
A golden cross occurs when a shorter moving average rises above a longer one and is interpreted as bullish. A death cross occurs when the shorter average falls below the longer one and is interpreted as bearish. The classic version uses 50-day and 200-day moving averages, though forex traders can adapt the periods and timeframe.
Why do moving average crossovers give false signals?
Both averages lag because they are calculated from historical prices. In sideways markets, small price swings pull the fast average above and below the slow one without producing a sustained trend. Higher-timeframe alignment, trend-strength checks, and price-action confirmation can reduce these whipsaws, but no filter removes them entirely.
Can a moving average crossover strategy be automated?
Yes. Its inputs and decisions can be defined precisely, which makes the strategy suitable for an EA. Code the MA type, periods, candle-close rule, trend filters, position sizing, stops, and exits explicitly. Then test with realistic costs and run the EA in a stable environment while continuing to monitor it.

About the author
Matthew Hinkle
Lead Writer & Full Time Retail Trader
Matthew is NYCServers' lead writer. In addition to being passionate about forex trading, he is also an active trader himself. Matt has advanced knowledge of useful indicators, trading systems, and analysis.
Areas of Expertise