
Walk-Forward Optimization & Monte Carlo Testing for EAs
Learn walk-forward optimization and Monte Carlo testing for EAs — beat curve-fitting, read drawdown distributions, and build a pre-live robustness workflow.
Why a Great Backtest Is Not Enough (Over-Optimization & Curve-Fitting)
Every profitable-looking backtest hides the same uncomfortable question: did the strategy find a real edge, or did it just memorize the past? A single historical run can be tuned until the equity curve looks perfect, and that perfection is exactly what should make you suspicious. The gap between a beautiful backtest and disappointing live results is one of the most common failures in automated trading, and walk-forward optimization and Monte Carlo testing exist specifically to close it.
The core problem is over-optimization, also called curve-fitting. When you optimize an Expert Advisor by sweeping its parameters across one block of history, the optimizer will happily hand you the exact settings that would have printed the smoothest curve on those particular bars. Those settings are fitted to noise — the random wiggles of that specific period — as much as to any durable market behavior. Change the period, and the edge evaporates.
The tell-tale signs of a curve-fit system are familiar: dozens of finely tuned inputs, an equity curve with almost no losing stretches, and results that collapse the moment you nudge one parameter by a single step. A robust strategy degrades gracefully when conditions shift. A curve-fit one falls off a cliff. The rest of this guide walks through the two methods that expose the difference — walk-forward optimization and Monte Carlo simulation — and combines them into a repeatable pre-live checklist.
Walk-Forward Optimization Explained (In-Sample vs Out-of-Sample)
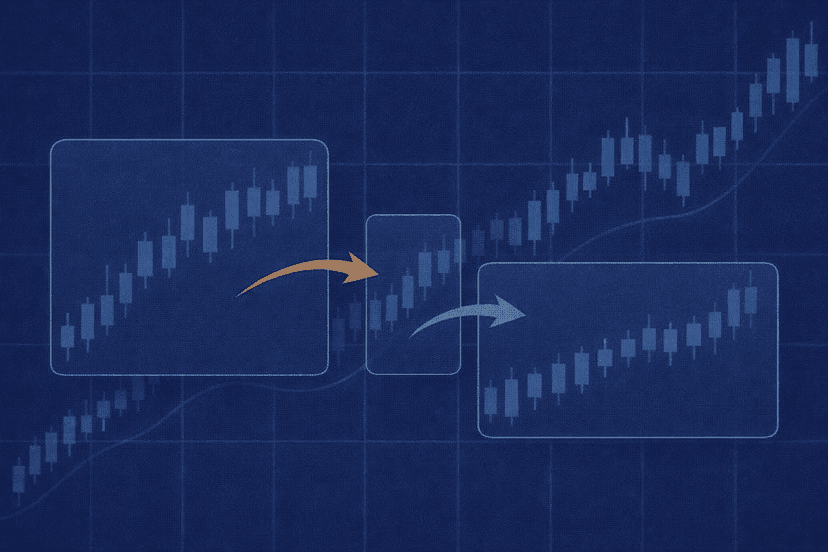
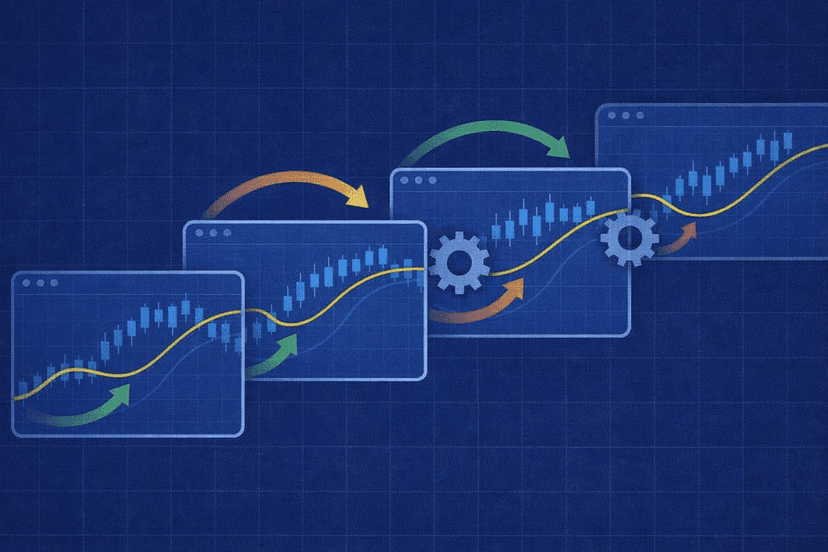
Walk-forward optimization is the antidote to fitting parameters to a single block of history. Instead of optimizing across all your data at once, you split the timeline into segments and repeatedly optimize on one segment, then test on the next, unseen segment. The data the optimizer sees is called the in-sample window; the data you validate on afterward is the out-of-sample window.
The logic is simple and powerful. Optimization always produces the best-looking settings for the data it can see. The only honest question is whether those settings still work on data they were never tuned against. By forcing every set of optimized parameters to prove itself on a fresh out-of-sample window, walk-forward optimization simulates what actually happens live: you pick settings from the past and then trade an unknown future.
A typical single step looks like this: optimize the EA on, say, twelve months of data, then apply those winning parameters — unchanged — to the following three months and record the result. That three-month result is out-of-sample and far more trustworthy than any in-sample number, because the strategy had no opportunity to fit it. You then roll the whole window forward and repeat, building a chain of out-of-sample results that, stitched together, form a walk-forward equity curve. If that stitched-together out-of-sample curve holds up, you have real evidence the edge survives outside the optimizer’s reach.
This is a different discipline from simply running a clean backtest. If you are still setting up your testing environment, our walkthrough on setting up the MetaTrader 5 Strategy Tester for accurate back-tests covers the data quality and modeling settings that walk-forward analysis depends on.
Rolling vs Anchored Walk-Forward & Walk-Forward Efficiency
There are two ways to move the window forward, and the choice affects what you are really testing.
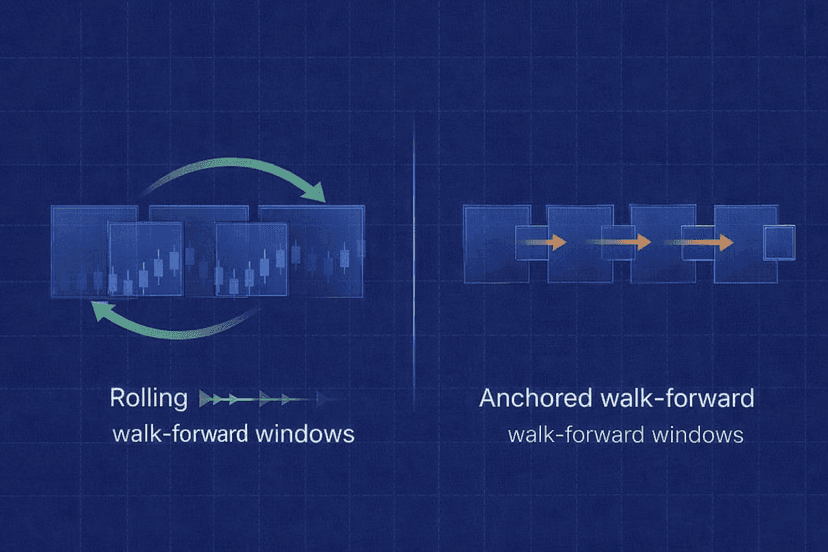
Rolling (or sliding) walk-forward keeps the in-sample window a fixed length and slides it forward each step, so the optimization always uses the most recent block of history and gradually forgets older data. This suits strategies you expect to adapt to changing market regimes — recent behavior weighs more than the distant past.
Anchored walk-forward fixes the start date and lets the in-sample window grow with each step, so the optimizer always sees all history from the beginning up to the current point. This suits strategies meant to capture a stable, long-run edge, and it tests whether the system stays robust as more and varied data accumulates.
To judge the results objectively, walk-forward analysis uses a metric called walk-forward efficiency (WFE): the ratio of out-of-sample performance to in-sample performance, usually expressed as a percentage. If your in-sample runs produced an average annualized return and the out-of-sample runs delivered a similar figure, WFE is high — the strategy performs nearly as well on unseen data as on optimized data. A low WFE means the strategy looks great only when it can peek at the answers.
- WFE near or above 50–60% is often treated as a sign the edge is reasonably durable (thresholds vary by system and are heuristics, not guarantees).
- WFE well below that, or wildly inconsistent out-of-sample steps, points to curve-fitting: the in-sample glory does not carry forward.
- WFE above 100% occasionally happens by chance; treat suspiciously good numbers with the same caution as suspiciously smooth curves.
Efficiency is a comparison tool, not a verdict on its own. A strategy with modest but consistent out-of-sample steps is usually safer than one with a single spectacular step and several poor ones.
How to Run Walk-Forward (MT5 Forward Mode + Tools)
You do not need exotic software to start. The MetaTrader 5 Strategy Tester includes a built-in Forward testing option that automatically splits your date range, optimizing on the first portion and validating on the reserved forward portion. You choose a split (for example, 1/2, 1/3, or 1/4 of the range reserved for forward testing), run the optimization, and MT5 reports both the in-sample and the forward results so you can compare them directly. MetaQuotes documents the mechanics in the official MT5 forward optimization documentation. This single split is a basic form of out-of-sample validation and a sensible first step before committing to full multi-window walk-forward analysis.
For true rolling or anchored walk-forward across many windows, dedicated tools automate the repeated optimize-then-forward cycle and calculate walk-forward efficiency for you. Platforms commonly used for this include StrategyQuant, Forex Tester, and various MT5-oriented walk-forward analyzers. The specifics of each tool change over time, so treat any feature claim as something to verify in the current version rather than gospel — the value here is the method, not a particular vendor’s menu. Our roundup of the best forex backtesting software compares several of these tools if you are choosing one.
Whatever tool you use, the discipline is identical: optimize on in-sample data, lock the parameters, measure on out-of-sample data, roll forward, and repeat. The software just removes the manual bookkeeping. One practical caution — walk-forward runs multiply the compute of a normal optimization many times over, because each window is its own optimization pass. A multi-year rolling analysis with a wide parameter space can tie up a machine for hours or days, which is where dedicated, always-on hardware starts to matter.
Monte Carlo Testing: What It Randomizes and Why
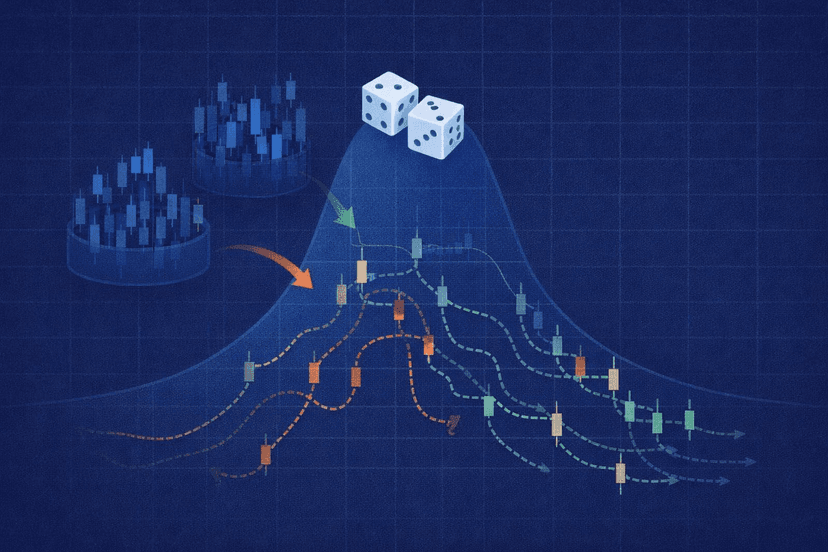
Walk-forward optimization asks whether your parameters survive unseen data. Monte Carlo testing asks a different question: how much did luck shape the specific result you got? A backtest is just one path through history — one particular order of trades, one set of fills. Monte Carlo simulation takes your strategy’s trade results and re-runs them thousands of times with small, realistic perturbations, producing a distribution of outcomes instead of a single lucky (or unlucky) number.
The most common things a Monte Carlo engine randomizes are:
- Trade sequence: shuffling the order in which your trades occurred. The same set of wins and losses can produce a mild drawdown in one order and a portfolio-threatening one in another. Reordering exposes how bad the drawdown could have been.
- Slippage and spread: adding a few points of adverse fill to each trade to simulate real execution friction rather than the tester’s clean prices.
- Skipped trades: randomly dropping a percentage of trades, simulating the reality that you will miss some signals to disconnects, downtime, or hesitation.
- Starting conditions: varying the starting equity or entry timing so the result does not hinge on one fortunate beginning.
By perturbing these variables across thousands of runs, Monte Carlo builds a realistic picture of the range of outcomes a robust strategy might actually experience — not just the single storyline the backtest happened to record. A strategy whose fortunes swing wildly under mild randomization was never as reliable as its backtest suggested.
Reading Monte Carlo Output (Drawdown Distribution, Confidence, Probability of Ruin)
The output of a Monte Carlo run is a set of distributions rather than single figures, and learning to read them is where the value lives. Three readouts matter most.
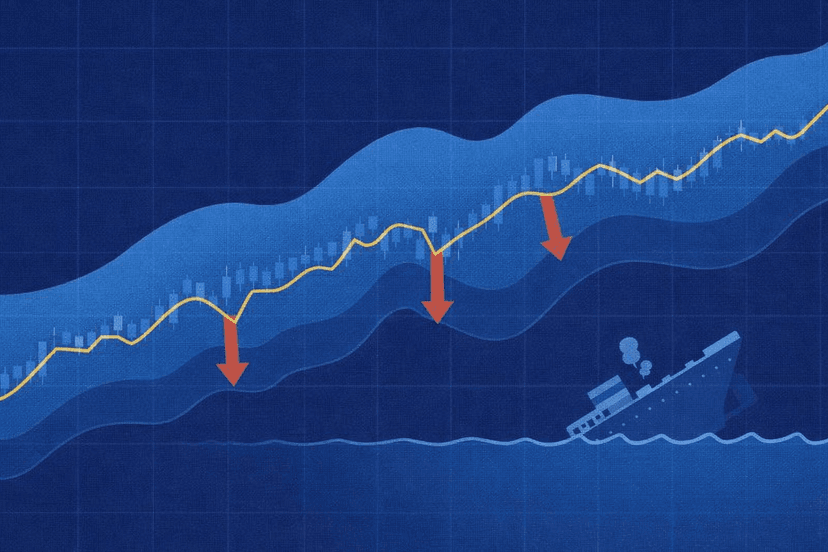
Drawdown distribution. Instead of one maximum drawdown, you get the full spread of maximum drawdowns across all simulated runs. This is usually the single most useful output, because it answers the question that actually determines whether you can stick with a system: how deep could the pain realistically get? A backtest might show a 15% maximum drawdown while the Monte Carlo distribution reveals that a quarter of simulations breached 25%.
Confidence bands. Results are typically reported at percentiles — for example the 95th percentile drawdown, meaning 95% of simulations stayed shallower than that figure. Planning around a high-percentile drawdown rather than the single backtest number is what separates traders who survive a rough stretch from those who abandon a sound system at the worst moment.
Probability of ruin. Many engines estimate the percentage of simulations in which the account fell below a chosen threshold — say, a 50% loss or full account blow-up. Any meaningful probability of ruin at a position size you intended to trade is a direct instruction to trade smaller.
| Readout | Single backtest says | Monte Carlo distribution reveals |
|---|---|---|
| Max drawdown | One number (e.g. 15%) | Full range; e.g. 95th percentile at 26% |
| Return | One equity curve | Spread of final equities across runs |
| Risk of ruin | Not shown | % of runs breaching a loss threshold |
Read together, these turn a single, potentially lucky backtest into an honest risk profile. The goal is not a prettier number — it is knowing the worst you can reasonably expect before the market shows it to you.
A Practical Pre-Live Robustness Workflow (Pass/Fail Heuristics)
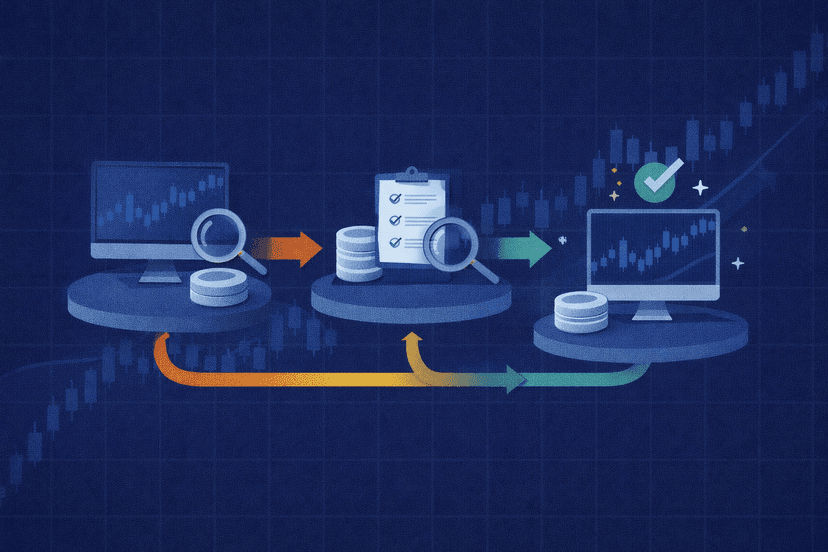
Here is how the two methods combine into a repeatable process you can run before any EA touches real money. Work the steps in order — each one is cheap insurance against a more expensive lesson later.
- 1. Clean baseline backtest. Highest-quality data, realistic spread, commission, and swap. A flawed test corrupts everything downstream.
- 2. Walk-forward optimization. Run rolling or anchored windows and check walk-forward efficiency. If out-of-sample performance collapses versus in-sample, stop — the edge is fitted.
- 3. Monte Carlo stress. Randomize trade order, slippage, and skipped trades over thousands of runs. Read the drawdown distribution and probability of ruin at your intended size.
- 4. Forward demo test. Run the survivor on a live-data demo account for several weeks to confirm behavior against real-time prices and spread.
- 5. Go live small. Start at minimum size, compare live fills to expectations, and scale only once they line up.
Worked example — hypothetical illustration only (not real or implied results). Suppose you have three years of data. You reserve the first two years as in-sample and the final year as out-of-sample. The optimizer’s best in-sample settings produce a hypothetical 40% annualized return; applied unchanged to the out-of-sample year they produce 24%. Walk-forward efficiency is 24 ÷ 40 = 60% — a reasonably durable result. You then feed that out-of-sample trade list into a Monte Carlo engine and run 5,000 simulations, shuffling trade order and adding one point of slippage per trade. The single backtest showed a 15% maximum drawdown, but the distribution reports a 95th-percentile drawdown of 26% and a 2% probability of breaching a 40% loss at your planned position size. The reading: the edge survives out-of-sample, but you should size for a 26% drawdown, not 15%. These figures are invented purely to show how the numbers relate; they are not a forecast, a claim, or a real EA’s performance.
As a rough pass/fail heuristic: consistent out-of-sample steps with a walk-forward efficiency that is not dramatically below in-sample, a Monte Carlo drawdown distribution you can psychologically and financially tolerate, and a negligible probability of ruin at your intended size. Fail any of those and the honest move is to reduce size, simplify the strategy, or shelve it — not to re-optimize until the numbers look nice again, which just re-introduces curve-fitting.
Honest Limits + Where a VPS Fits
Robustness testing reduces live risk. It does not eliminate it. Walk-forward optimization and Monte Carlo simulation both work from your historical trade data, and history cannot contain a market regime it has never seen — a novel shock, a liquidity crisis, or a structural change in how your instrument trades. These methods make curve-fitting far harder to hide and give you a realistic drawdown expectation, but they are risk-reduction tools, not guarantees. Treat any system that “passed” as validated-so-far, not bulletproof, and keep position sizing conservative regardless of how clean the numbers look.
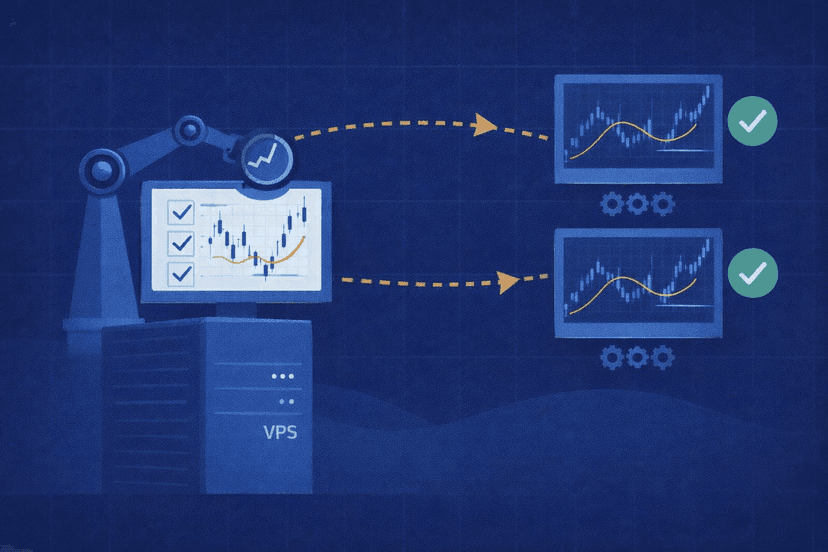
Where does infrastructure come in? Two honest places, and it is worth being precise: walk-forward optimization and Monte Carlo testing do not require a VPS — you can run them on any capable computer. But a VPS helps with the practical realities around them.
- Long unattended runs. Multi-window walk-forward optimizations and large Monte Carlo batches can run for hours or days. An always-on MT5 VPS lets those jobs churn in a data center without tying up your home PC or risking a lost run when the machine sleeps or reboots.
- Running the validated EA 24/5. Once a strategy clears your robustness workflow and forward demo test, it still has to execute reliably live. A low-latency VPS keeps the EA connected around the clock and cuts the round-trip time to your broker, which reduces the very execution friction — slippage and missed fills — that Monte Carlo told you to respect. You can measure latency to your broker with our broker latency checker.
Put plainly: robustness testing tells you whether a strategy deserves to go live; a VPS helps you run the tests without hijacking your computer and then run the validated EA the way it was designed to run. Neither one turns a fitted strategy into a good one — that distinction is the whole point.
Frequently Asked Questions
What is the difference between walk-forward optimization and Monte Carlo testing?
Walk-forward optimization tests whether your optimized parameters survive on unseen data by repeatedly optimizing on an in-sample window and validating on the next out-of-sample window. Monte Carlo testing takes a set of trade results and re-runs them thousands of times with randomized trade order, slippage, and skipped trades to reveal the range of outcomes — especially the drawdown distribution and probability of ruin. Walk-forward attacks curve-fitting; Monte Carlo attacks the illusion that one lucky backtest path is representative. Use both.
What is a good walk-forward efficiency?
Walk-forward efficiency is the ratio of out-of-sample to in-sample performance. Many traders treat roughly 50–60% or higher as a sign the edge is reasonably durable, but this is a heuristic, not a rule — it varies by strategy, market, and how the windows are configured. Consistency across out-of-sample steps matters more than a single high number. A strategy with steady, moderate out-of-sample results is usually safer than one with a single spectacular window and several weak ones.
Do I need a VPS to run walk-forward or Monte Carlo tests?
No. Both methods run on any capable computer and do not require a VPS. A VPS helps in two practical ways: it lets long, compute-heavy optimization and simulation runs finish unattended in a data center without tying up your home machine, and once a strategy is validated, it runs the live EA 24/5 with low latency to your broker. The testing itself is not VPS-dependent; the convenience and the eventual live execution are where it earns its place.
Can robustness testing guarantee my EA will be profitable live?
No. Walk-forward optimization and Monte Carlo testing work from historical data, and history cannot contain a market condition it has never experienced. These methods dramatically reduce the risk of deploying a curve-fit system and give you a realistic drawdown expectation to size around, but they cannot promise future profits. Treat a strategy that passes as validated-so-far, keep position sizing conservative, and always confirm with several weeks of live-data demo forward testing before committing real capital.

About the author
Thomas Vasilyev
Writer & Full Time EA Developer
Tom is our associate writer, and has advanced knowledge with the technical side of things, like VPS management. Additionally Tom is a coder, and develops EAs and algorithms.
Areas of Expertise