
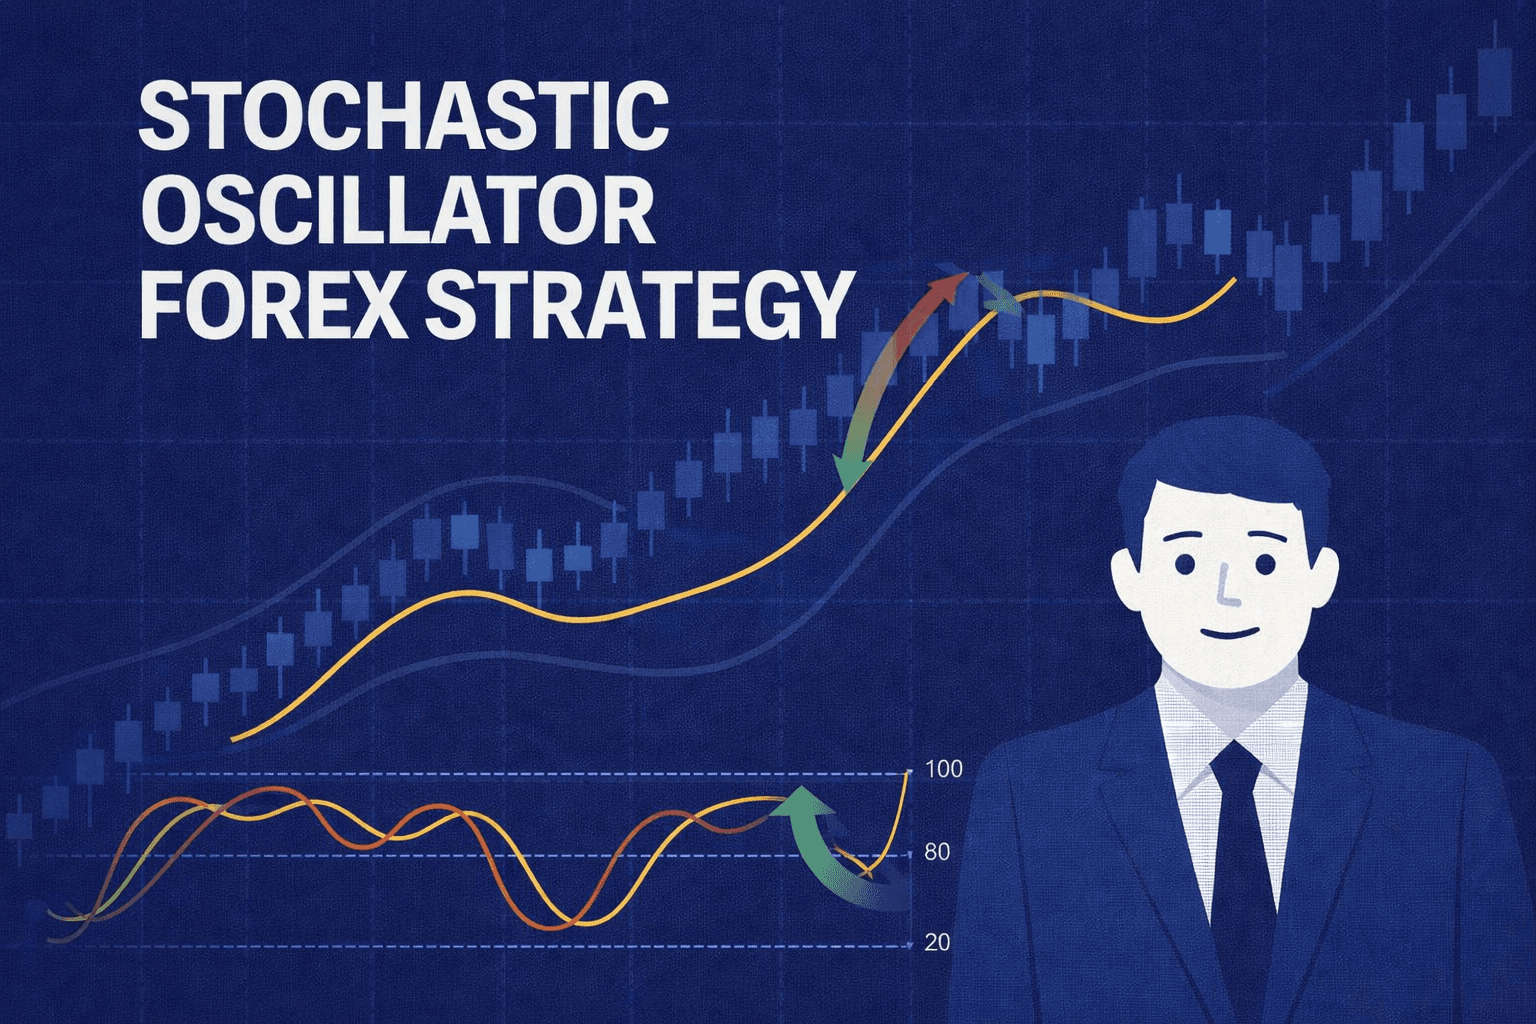
Stochastic Oscillator Forex Strategy: Settings and Signals
Use a stochastic oscillator forex strategy with practical 14,3,3 settings, crossover and divergence signals, trend filters, and clear risk rules.
A workable stochastic oscillator forex strategy does not buy every oversold reading and sell every overbought one. It uses the oscillator for what it actually measures — where the latest close sits inside a recent high-low range — and takes trades only when trend context, a pullback into an extreme, a confirmed trigger, and price confirmation all line up.
The quick verdict: start with the 14,3,3 configuration that platforms ship as their default, keep the 20 and 80 zones as your baseline, and treat a reading above 80 or below 20 as information about momentum rather than a trade instruction. Everything below turns that into a repeatable checklist, including where the stop goes and what makes you skip the setup entirely.
What the Stochastic Oscillator Measures
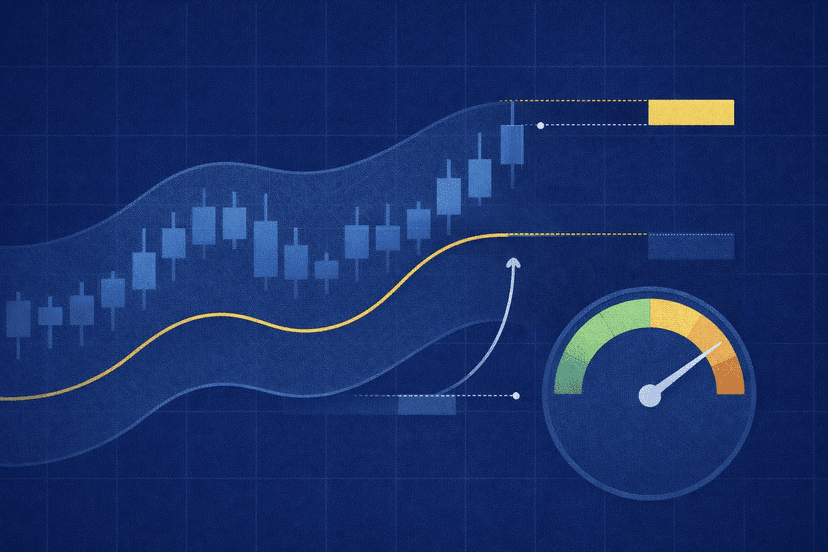
The oscillator answers one narrow question: relative to the highest high and the lowest low of the last N bars, how close is the current close to the top of that range? MetaTrader states the calculation directly as %K = 100 × (close − lowest low) / (highest high − lowest low), with %D as a moving average of %K.
In plain English: if EUR/USD closed at the very top of its 14-bar range, %K prints near 100. If it closed at the very bottom, %K prints near 0. A mid-range close prints near 50. Because the formula divides by the range itself, the result is bounded between 0 and 100 no matter which pair or timeframe you apply it to.
You get two lines in the subwindow. %K is the raw (or lightly smoothed) calculation and moves first. %D is an average of %K, and eSignal’s documentation notes the practical consequence: %D reacts less sensitively than %K. That difference in speed is what creates the crossovers traders act on.
Two things follow from the formula. First, a high reading means recent closes have been strong within the range, not that price must fall. Second, the reading is entirely relative to the lookback window you choose — which is why settings matter more here than in most indicators.
Best Stochastic Settings for Forex
TradingView’s current built-in defaults are K = 14, D = 3, Smooth = 3, and that is the sensible baseline for forex. eSignal documents the same 14-bar lookback with D = 3 in its own implementation. Two platforms converging on the same numbers makes 14,3,3 a reasonable starting point — it is not evidence of profitability.
Three parameters control the output:
- %K period — how many bars form the high-low range. Larger values widen the range, so extreme readings become rarer and more meaningful.
- %D period — the moving-average length applied to %K. This is your signal line.
- Slowing (smoothing) — extra smoothing applied to %K itself. Fidelity notes that a slowing period of 3 produces the slow Stochastic, while a value of 1 is equivalent to the fast Stochastic. On TradingView, Smooth = 1 simply disables the extra %K smoothing.
| Configuration | Behaviour | Use it for |
|---|---|---|
| 14, 3, 3 (slow) | Balanced baseline; smoothed %K, fewer whipsaws | Default starting point for swing and intraday forex |
| 14, 3, 1 (fast) | Same lookback, no extra %K smoothing — faster and noisier | A test configuration when signals feel too late |
| 5, 3, 3 (short lookback) | Very responsive; extremes hit often | A test configuration only — it appears in the MQL5 code example, not as a universal default |
Fidelity identifies 80 and 20 as the most common adjustable zone levels, and that is where you should start. Tightening to 90/10 is an optional stricter test: you get fewer signals, and in a strong trend you may get none at all for long stretches. Loosening the zones does the opposite and usually adds noise.
One detail traders routinely miss: the settings count bars, not time. A 14-period lookback on the H1 chart covers roughly half a day; the same 14 on the daily chart covers nearly three trading weeks. Changing timeframe changes what “14” means, so settings validated on one chart do not transfer automatically to another.
If you automate this, the MQL5 iStochastic function exposes K period, D period, slowing, the moving-average method, and the price field used for the calculation. MetaQuotes’ own code example uses 5,3,3 with a simple moving average and low/high price calculation — a demonstration of the API, not a recommended forex configuration. Keep each platform’s parameter order straight, because the labels differ.
How to Read Stochastic Signals
MetaTrader lists three common interpretations of the indicator. They are the same three you should build rules around, and none of them works well in isolation.
| Signal | What it looks like | What it actually tells you |
|---|---|---|
| Zone exit | The line rises back through 20, or falls back through 80 | Price has stopped closing at the extreme of its recent range |
| %K/%D crossover | %K crosses above or below the slower %D line | Short-term momentum has turned relative to its own average |
| Divergence | Price and the oscillator disagree at a swing extreme | The latest price extreme was not matched by range position |
Zone exits beat zone entries
Entering the moment %K crosses under 80 in a strong uptrend is how traders end up short in a market that keeps making highs. Waiting for the line to re-cross the level from the extreme side is stricter and slower, and it filters out the readings that simply sit pinned at the extreme while the trend continues.
Crossovers need location
%K crossing %D in the middle of the range happens constantly and means very little. A crossover at or near an extreme — below 20 for longs, above 80 for shorts — at least tells you something about where price sits in its recent range. Read the cross on a completed candle; a cross that exists mid-bar can be gone by the close.
Divergence is a warning, not a trigger
Fidelity’s slow stochastic guide defines bullish and bearish divergence precisely. Bullish divergence is price making a lower low while the oscillator makes a higher low. Bearish divergence is price making a higher high while the oscillator makes a lower high. Either says the newest price extreme was not confirmed by range position — useful context, but it does not tell you the reversal starts now, and divergences can repeat several times before price responds.
Underpinning all three: an overbought reading need not mean an imminent decline, and oversold need not mean an imminent rise. TradingView’s own guidance is to align signals with the prevailing trend and add a second directional check such as trend lines. That is exactly what the next section does.
A Practical Stochastic Oscillator Forex Strategy
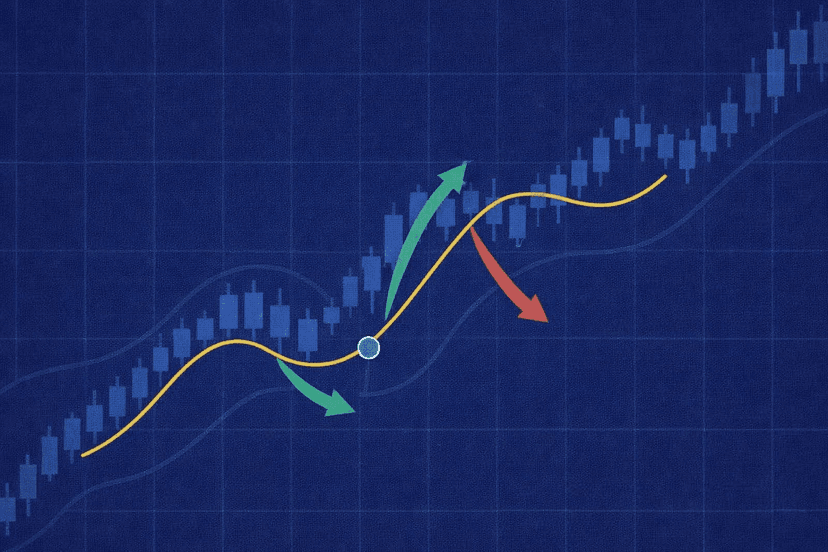
This ruleset uses the oscillator to time entries with the trend rather than against it. Every condition must be true before you place an order. If one is missing, there is no trade.
- Establish the trend. Read price structure — higher highs and higher lows for an uptrend — or use a trend filter you have already chosen and stick to it. Unclear structure is a skip, not a coin flip.
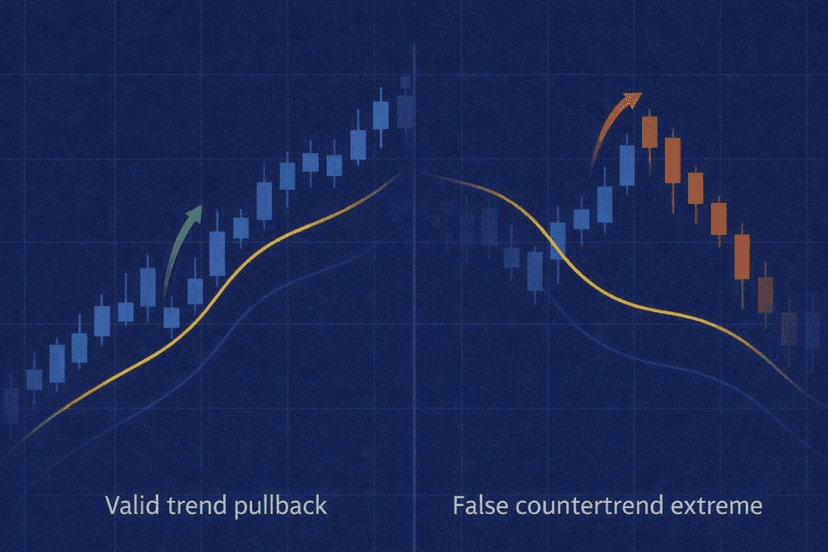
- Wait for the pullback. In an uptrend, wait for the oscillator to drop below 20. You are looking for a temporary retracement inside a trend, not a collapse.
- Require a confirmed trigger. %K above %D, and preferably a close with the line back above 20. Both conditions read on a completed candle.
- Demand price confirmation. A bullish candle closing above the pullback’s recent highs, a hold at a support level, or a break of the pullback’s minor trend line. The oscillator times the entry; price validates it.
- Place the stop beyond the swing low. The level that invalidates the setup sits under the pullback low, not at a round pip number. Size the position from that distance.
- Define the exit before entry. A prior swing high, a structural resistance level, or a predefined reward-to-risk plan. Decide it while you are still flat.
Mirror every step for shorts: downtrend structure, oscillator above 80, %K below %D and preferably a close back under 80, bearish price confirmation, stop beyond the swing high, target at prior support.
Trade it or skip it
- Skip when trend context is unclear or price is chopping sideways without structure.
- Skip when spreads are abnormally wide or a scheduled release makes execution unpredictable.
- Skip when the trigger fired but price never confirmed.
- Skip when the only valid stop location makes the risk unacceptable for your account.
- Trade only when trend, pullback, trigger, confirmation, and a sane stop are all present at once.
How to Reduce False Signals and Test Settings
The oscillator behaves very differently depending on regime. In a range, price genuinely rotates between the extremes and zone signals do their best work. In a strong trend, the line can sit pinned above 80 or below 20 for extended runs while price keeps going — the same reading that was a reversal cue in the range becomes a continuation signal in the trend.
The fix is context, not more indicators. Combine the oscillator with support and resistance levels or a single trend-direction check. Stacking three momentum oscillators that all derive from recent closes gives you correlated opinions and false confidence, not independent confirmation.
Two more filters cut the worst signals cheaply. Act only on completed candles, which removes cross signals that vanish before the bar closes. And require the signal to occur at or near an extreme rather than anywhere on the scale.
Test before you commit
Backtest separately by pair, by timeframe, and by session, with realistic spread assumptions built in. A configuration that looks clean on EUR/USD during London can fall apart on a wider-spread cross in thin Asian hours. Then forward-test on demo, where live spreads and slippage apply.
Track a fixed set of numbers for every variant you test: the exact signal definition, win and loss counts, average reward-to-risk, maximum drawdown, and sample size. Do not optimise for win rate alone — a rule that wins often but loses more per loss than it makes per win is a losing rule, and a result drawn from fifteen trades tells you nothing either way.
Conclusion: A Repeatable Stochastic Checklist
The sequence is always the same: context, then pullback into an extreme, then a confirmed trigger, then price confirmation, then predefined risk and exit. Skip any step and you are trading a number on a 0–100 scale rather than a market.
Start at 14,3,3 with 20/80 zones because that is the documented baseline, then test variations deliberately and one at a time before deploying an automated version on an MT5 VPS. No configuration is best for every pair, every timeframe, or every market regime, and any source claiming otherwise is selling something.
Frequently Asked Questions
Is 14,3,3 the best stochastic setting for forex?
It is the best starting point, not a proven optimum. K = 14, D = 3, Smooth = 3 is TradingView’s current built-in default, and eSignal documents the same 14-bar lookback with D = 3. Treat it as a documented baseline, then test alternatives per pair and timeframe with realistic costs.
What is the difference between fast and slow stochastic?
The slowing parameter. Fidelity explains that a slowing period of 3 produces the slow Stochastic, while a value of 1 is equivalent to the fast Stochastic. The fast version reacts sooner because %K receives no extra smoothing, which also means more whipsaws.
Is the stochastic oscillator good for scalping?
It can be part of a scalping ruleset, and shorter configurations such as 5,3,3 respond faster. Lower timeframes generate far more extreme readings and far more noise, and spread plus slippage consume a larger share of each trade, so test the exact configuration on demo before risking capital.
Can stochastic stay overbought or oversold for a long time?
Yes, and this is the single most common way traders lose money with it. An overbought reading need not mean an imminent decline, and oversold need not mean an imminent rise. In a strong trend the line can remain at an extreme for many bars, which is why trend alignment and a second directional check matter more than the reading itself.
Stochastic vs RSI — which should you use?
They measure different things. The Stochastic Oscillator locates the close within a recent high-low range and plots two lines, %K and %D, which produces crossover signals. RSI measures the relative size of recent gains against recent losses on a single line. Running both adds little independent information, so pick one and pair it with structure or trend context instead. Note also that the classic Stochastic Oscillator is not Stochastic RSI, which applies the stochastic formula to RSI values rather than to price.

About the author
Matthew Hinkle
Lead Writer & Full Time Retail Trader
Matthew is NYCServers' lead writer. In addition to being passionate about forex trading, he is also an active trader himself. Matt has advanced knowledge of useful indicators, trading systems, and analysis.
Areas of Expertise