Mean Reversion Trading in Forex: Strategy Guide for 2026
Learn how mean reversion trading works in forex markets. Complete guide covering indicators, entry/exit rules, best currency pairs, and risk management strategies.

What Is Mean Reversion Trading?
Mean reversion is a trading strategy based on a simple statistical principle: prices tend to return to their average over time. When a currency pair moves significantly above or below its historical average, mean reversion traders bet it will snap back.
The theory assumes markets overreact. News events, sentiment shifts, and short-term volatility push prices to extremes. But these extremes don’t last. Eventually, the market corrects itself and prices drift back toward their mean.
In forex, this means watching for currency pairs that have stretched too far from their moving averages. When EUR/USD spikes 150 pips above its 20-period SMA in a ranging market, mean reversion traders see opportunity. They’re not predicting direction. They’re betting on normalization.
How Mean Reversion Differs from Trend Following
Trend followers and mean reversion traders see the same chart differently. A trend follower watches EUR/USD break above resistance and thinks “momentum is building, buy the breakout.” A mean reversion trader sees the same move and thinks “price is overextended, prepare to fade the move.”
Neither approach is inherently better. They work in different market conditions:
- Mean reversion excels in ranging, sideways markets where prices oscillate within boundaries
- Trend following excels in strongly directional markets with clear momentum
The forex market spends roughly 70-80% of time in consolidation phases. That’s why mean reversion strategies have a theoretical edge in terms of opportunity frequency. But when trends do emerge, they can be powerful enough to wipe out months of mean reversion profits in days.
Key Indicators for Mean Reversion
Mean reversion traders rely on indicators that measure how far price has deviated from its average. Here are the most effective tools:

Bollinger Bands
Bollinger Bands plot a moving average with upper and lower bands at standard deviations (typically 2) above and below. When price touches or breaches the outer bands, it signals a potential overextension.
The logic is statistical. In a normal distribution, approximately 95% of price action should occur within 2 standard deviations of the mean. When price moves outside the bands, it’s statistically unlikely to stay there.
Mean reversion signals:
- Price touches upper band → Look for short opportunities
- Price touches lower band → Look for long opportunities
- Band squeeze followed by expansion → Prepare for reversion after the volatility spike
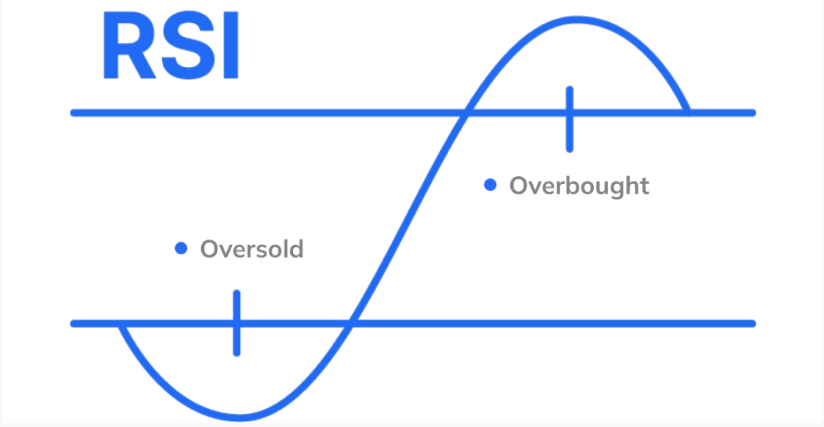
Relative Strength Index (RSI)
RSI measures momentum on a scale of 0-100. Readings above 70 indicate overbought conditions; readings below 30 indicate oversold conditions. Mean reversion traders use these extremes as entry triggers.
The standard 14-period RSI works for swing trading. Shorter periods (7 or 9) generate more signals for intraday mean reversion. Longer periods (21+) filter out noise for position trading.
RSI divergence strengthens signals. When price makes a new high but RSI makes a lower high, the momentum behind the move is weakening. The probability of reversion increases.

Moving Average Deviation
Simple approach: measure how far price has moved from its moving average as a percentage. If EUR/USD typically doesn’t stray more than 1% from its 50 SMA before reverting, a 1.5% deviation represents a high-probability setup.
Track historical deviations to establish normal ranges for each pair you trade. Some pairs mean-revert tightly; others trend for extended periods before normalizing. If you’re exploring algorithmic trading strategies, this quantitative approach translates well into automated systems.

Z-Score
Z-score measures how many standard deviations price is from the mean. A Z-score of +2 means price is 2 standard deviations above average. This quantifies overbought/oversold conditions more precisely than RSI.
Formula: Z = (Current Price – Mean Price) / Standard Deviation
Professional mean reversion algorithms often use Z-score thresholds. Enter when Z exceeds +2 or falls below -2. Exit when Z returns to zero.
Entry and Exit Rules
Successful mean reversion requires clear rules. Discretionary “it looks stretched” judgments lead to inconsistent results.
Entry Criteria
Conservative approach:
- Price touches Bollinger Band outer boundary
- RSI confirms overbought (>70) or oversold (<30)
- Look for candlestick reversal pattern (engulfing, pin bar, doji)
- Enter on confirmation candle close
Aggressive approach:
- Price breaches Bollinger Band
- Enter immediately in opposite direction
- Use tight stop-loss beyond the deviation extreme
The aggressive approach generates more signals but lower win rate. The conservative approach misses some opportunities but offers higher probability per trade.
Exit Criteria
The target is the mean. Most mean reversion traders exit when:
- Price returns to the middle Bollinger Band (20 SMA)
- RSI returns to the 40-60 neutral zone
- A predetermined pip target is reached
- Time-based exit (if price hasn’t reverted within X periods, close the trade)
Don’t hold for full reversions to the opposite extreme. Mean reversion isn’t about catching the entire move. It’s about capturing the high-probability portion back to average.

Best Currency Pairs for Mean Reversion
Not all forex pairs mean-revert equally. Research from QuantPedia and academic studies shows that forex generally trends more than stocks. But within forex, some pairs exhibit stronger mean-reverting behavior:
Range-Bound Pairs
EUR/CHF historically trades in tight ranges due to Switzerland’s monetary policy interventions. When it deviates, reversion is often swift.
AUD/NZD is a popular mean reversion pair. Both economies are similar (commodity-based, similar interest rate environments), so the cross tends to oscillate within defined boundaries.
EUR/GBP often ranges during quiet periods, making it suitable for mean reversion strategies during non-news sessions.
Major Pairs During Consolidation
EUR/USD and USD/JPY can exhibit mean-reverting behavior during consolidation phases, particularly between major economic releases. The key is identifying when these pairs are ranging versus trending.
Best Times to Trade Mean Reversion
Timing matters. Mean reversion works best when volatility is contained:
Asian session (23:00-07:00 GMT) often provides ideal conditions. Major pairs like EUR/USD consolidate during this period, creating range-bound price action perfect for mean reversion.
Pre-news periods see markets coiling before releases. Mean reversion can work here, but exit before the announcement. Post-news, trends often emerge that punish mean reversion positions.
Friday afternoons and Monday mornings can offer opportunities as markets digest weekly positioning without strong directional conviction.
Avoid:
- Major news releases (NFP, FOMC, ECB)
- London/New York session opens (first 1-2 hours)
- Strong trending environments
Risk Management for Mean Reversion
Mean reversion carries a specific risk profile. High win rates mask the potential for catastrophic losses when markets trend instead of reverting.
Stop-Loss Placement
Place stops beyond the extreme deviation, not at it. If you’re fading a move to the upper Bollinger Band, your stop should be above the band, not at it. This gives the trade room to breathe while capping maximum loss.
A common approach: stop-loss at 1.5x the distance from entry to the mean. If entering 50 pips from the mean, place the stop 75 pips from entry (125 pips from the mean).
Position Sizing
Mean reversion traders should size positions knowing that occasional large losses are inevitable. The math: if you win 80% of trades at 1R profit but lose 20% at 3R loss, you need strict position sizing to stay profitable.
Calculate position size so that your worst-case stop-loss represents 1-2% of account equity. Never add to losing positions hoping for reversion. Markets can remain “irrational” longer than your account can stay solvent.
When to Stop Trading
Recognize when market conditions have shifted. If you’re seeing multiple consecutive stop-outs, the market is likely trending. Step back, reassess, and wait for range-bound conditions to return.

Automating Mean Reversion Strategies
Mean reversion’s rule-based nature makes it ideal for automation. Expert Advisors can monitor multiple pairs simultaneously, calculate Z-scores in real-time, and execute entries without hesitation.
For traders interested in automated approaches, we’ve compiled a guide to the best mean reversion EAs currently available, covering performance metrics and strategy types.
Automated mean reversion requires reliable infrastructure. A strategy designed to catch small reversions multiple times per day can’t afford execution delays or downtime. Professional traders run these systems on dedicated VPS servers positioned close to broker infrastructure, ensuring consistent execution regardless of home internet conditions.
When Mean Reversion Fails
Mean reversion strategies suffer significant drawdowns in trending markets. When a currency pair breaks out of its range and establishes a new trend, prices don’t revert. They keep moving.
Historical examples:
- EUR/USD 2014-2015: Extended decline from 1.40 to 1.05. Mean reversion traders fading the move were repeatedly stopped out.
- USD/JPY 2012-2015: Massive trend from 78 to 125. Betting on reversion meant fighting the Bank of Japan.
- Post-pandemic 2020: Extreme volatility created trend moves that punished mean reversion systems.
The solution isn’t avoiding mean reversion. It’s recognizing when conditions favor it and when they don’t. Use trend filters (ADX, moving average slopes) to avoid taking mean reversion trades against established trends.
Frequently Asked Questions
What win rate should I expect from mean reversion?
Well-designed mean reversion strategies typically achieve 60-80% win rates. However, the average loss is often larger than the average win (targeting the mean means smaller profits than trend-following). Overall profitability depends on risk-reward balance, not win rate alone.
Is mean reversion better than trend following?
Neither is universally better. Mean reversion suits ranging markets; trend following suits directional markets. Many professional traders use both, switching based on market conditions or running parallel systems that naturally hedge each other.
Which timeframe works best for forex mean reversion?
H1 and H4 timeframes offer a balance between signal frequency and reliability. Lower timeframes (M15, M5) generate more signals but more noise. Daily timeframes provide cleaner signals but fewer opportunities. Your choice depends on trading style and availability.
Can I use mean reversion during news events?
Avoid it. News events often create trend moves that don’t revert in the short term. The volatility spike may look like an overextension, but it can be the start of a sustained move. Wait for post-news consolidation before resuming mean reversion trades.
How do I know if a market is ranging or trending?
Use the ADX (Average Directional Index). Readings below 20-25 suggest range-bound conditions favorable for mean reversion. Readings above 25-30 indicate trending conditions where mean reversion is riskier. Also observe Bollinger Band width. Narrow bands suggest consolidation; expanding bands suggest potential trend development.
What’s the minimum account size for mean reversion trading?
Start with whatever allows proper position sizing. If your stop-loss is 50 pips and you’re risking 1% per trade, you need an account that makes 50 pips = 1%. For most retail traders, $1,000-5,000 provides adequate flexibility for position sizing while learning the strategy.
Building Your Mean Reversion System
Mean reversion offers a statistically grounded approach to forex trading. The strategy’s core premise is sound. Markets do overreact, and prices do return to averages. The challenge is implementation.
Start by defining your rules. Which indicators will you use? What constitutes an entry signal? Where will you place stops and targets? Backtest these rules on historical data before risking capital.
Accept that mean reversion isn’t a holy grail. It works until it doesn’t. The traders who profit long-term are those who recognize when conditions favor the strategy and step aside when they don’t. Combine sound rules with disciplined risk management, and mean reversion can form a profitable component of your trading approach.

About the Author
Matthew Hinkle
Lead Writer & Full Time Retail Trader
Matthew is NYCServers' lead writer. In addition to being passionate about forex trading, he is also an active trader himself. Matt has advanced knowledge of useful indicators, trading systems, and analysis.