Forex Breakout Strategy: Identify and Trade Breakouts
Learn how to trade forex breakouts with confidence. Spot real breakouts vs fakeouts using volume, momentum, price action, and ATR confirmation signals.
What Is a Forex Breakout?
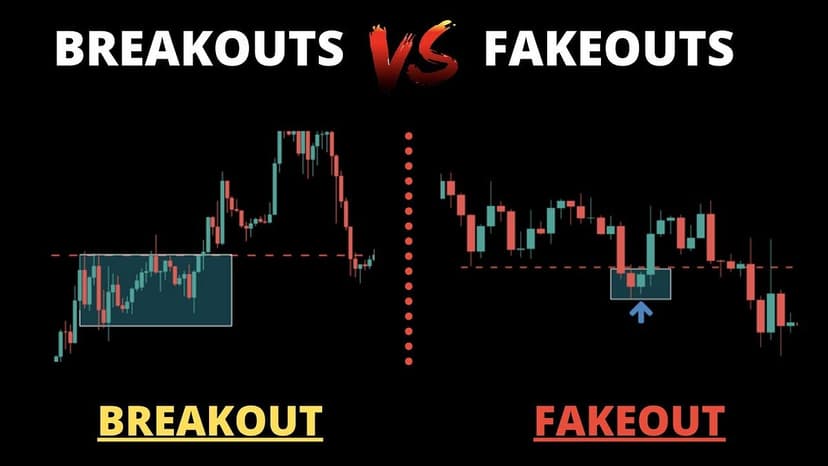
A forex breakout happens when price pushes beyond a defined support or resistance level and sustains the move. That level could be a horizontal zone, a trendline, or the boundary of a chart pattern like a triangle or wedge. When the break is genuine, it usually signals the start of a strong directional move — and that’s where the profit opportunity lives.
Breakout trading is one of the most popular strategies in forex for good reason. You’re not trying to predict tops or bottoms. Instead, you wait for the market to tell you where it wants to go and then ride the momentum.
The catch? Not every breakout is real. False breakouts — also called fakeouts — trap traders who enter too early, only to watch price reverse straight back into the range. The difference between a profitable breakout trader and one who bleeds money comes down to one skill: confirmation.
This guide covers everything you need to trade breakouts with confidence. You’ll learn how to identify high-probability setups, filter out fakeouts, and manage risk so that even when a trade goes against you, it doesn’t wreck your account.
Why Breakout Trading Works in Forex
Forex markets spend most of their time in consolidation. Price ranges between support and resistance while buyers and sellers reach equilibrium. That balance can’t last forever. When one side gains the upper hand, price breaks out of the range and trends.
Here’s what makes breakouts powerful:
- Institutional order flow: Large players — banks, hedge funds, algorithmic desks — accumulate positions during consolidation. When they’re ready to push, their volume drives a decisive break.
- Stop-loss cascades: Retail traders place stops just beyond support and resistance. A breakout triggers those stops, adding fuel to the move.
- Momentum attracts momentum: Once a breakout starts, trend-following algorithms and manual traders pile in. Volume expands and the move accelerates. Running automated strategies on a trading VPS lets you capture these moves 24/5 without being glued to the screen.
The longer price consolidates in a tight range, the more explosive the eventual breakout tends to be. A pair that has been range-bound for two weeks carries far more energy than one that consolidated for two hours. Keep this in mind when sizing your positions.
Types of Forex Breakout Patterns
Not all breakouts look the same. The pattern that forms before the break tells you a lot about what to expect next. Here are the setups you should know.
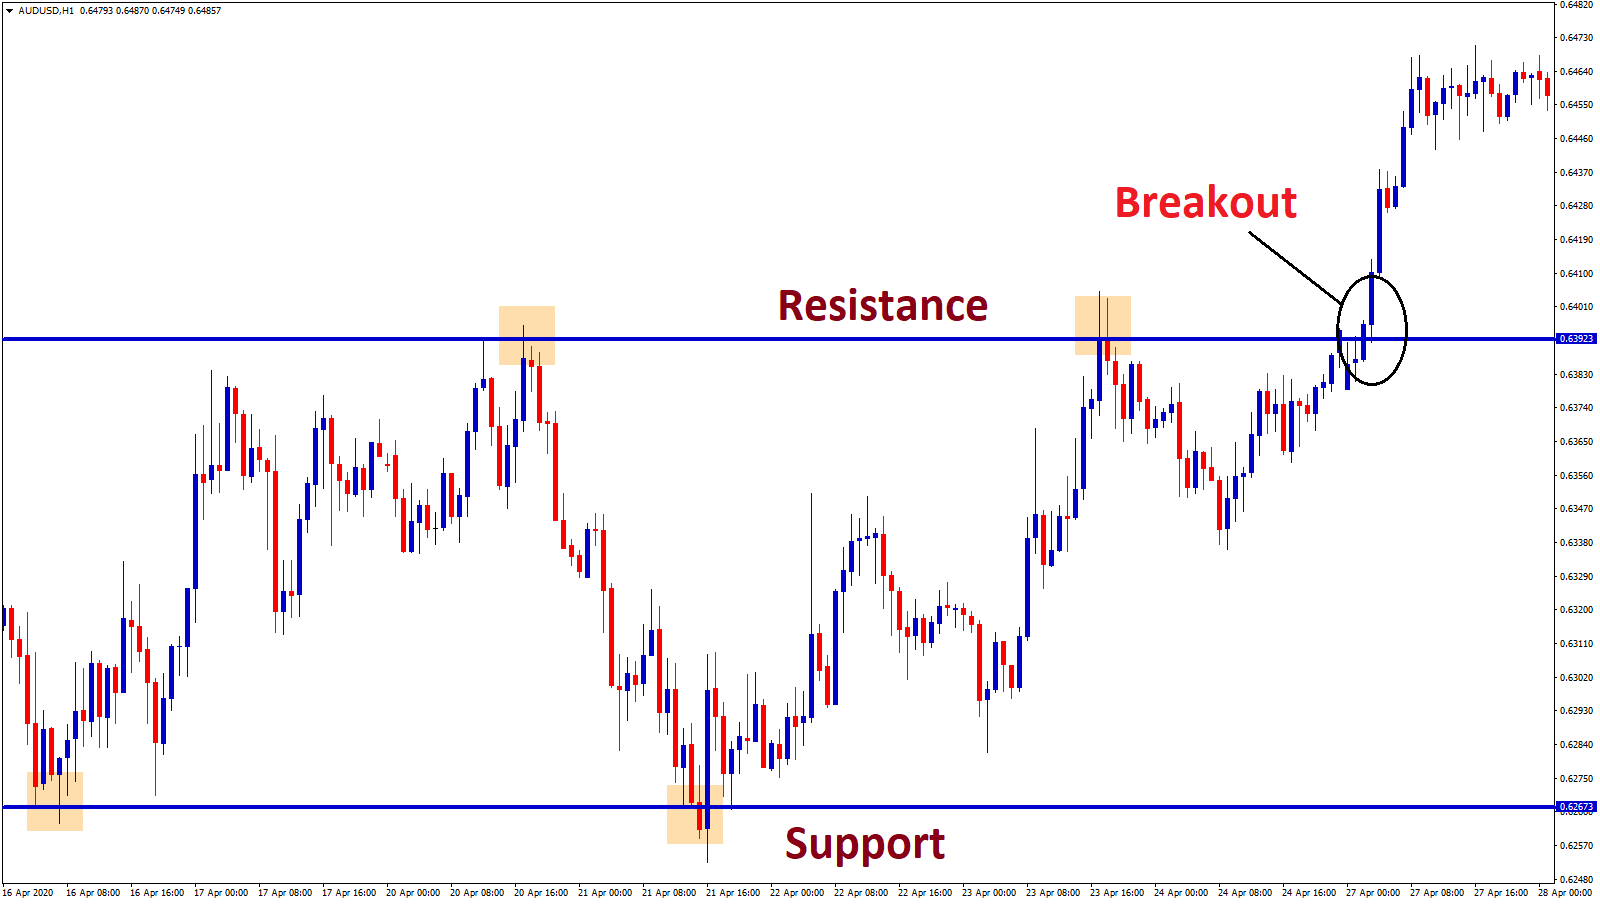
Horizontal Support and Resistance Breakouts
This is the classic breakout setup. Price tests a horizontal level multiple times, building a clear floor (support) or ceiling (resistance). The more times a level is tested and holds, the more significant the eventual break becomes.
When price finally closes beyond that level with conviction, it signals a shift in market structure. Former resistance becomes new support on a bullish breakout, and former support becomes new resistance on a bearish one.
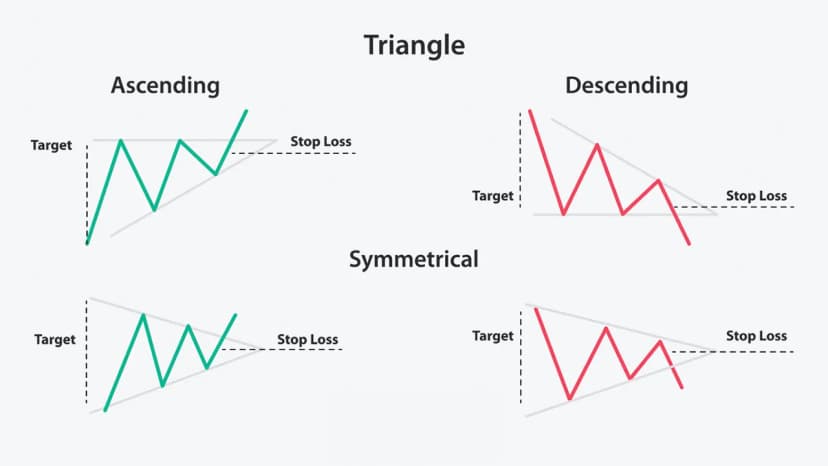
Triangle Breakouts
Triangles form when price makes a series of lower highs and higher lows (symmetrical), lower highs against flat support (descending), or higher lows against flat resistance (ascending). The narrowing range compresses volatility like a coiled spring.
Ascending triangles tend to break upward. Descending triangles tend to break downward. Symmetrical triangles can go either way — let the market decide before you commit.
Wedge Breakouts
Wedges use two converging trendlines, both sloping in the same direction. A rising wedge slopes upward and typically breaks bearish. A falling wedge slopes downward and typically breaks bullish. These are reversal patterns, so the breakout direction usually opposes the wedge slope.
Flag and Pennant Breakouts
Flags and pennants are continuation patterns that form after a sharp move. The flag is a small rectangle that slopes against the trend, while a pennant looks like a tiny symmetrical triangle. Both patterns represent a pause before the trend resumes.
The measured move target for a flag or pennant equals the length of the initial impulse move (the “flagpole”) projected from the breakout point. This gives you a built-in profit target.
Range Breakouts
Sometimes price simply trades between a flat support zone and a flat resistance zone with no clear pattern. These rectangular ranges are common during the Asian session, and breakouts from them often coincide with the London or New York open when volatility picks up. Our London breakout strategy guide covers session-specific setups in detail.
How to Identify a Real Breakout
This is where most traders get it wrong. They see price poke above resistance and jump in, only to get stopped out when it reverses. Real breakouts share specific characteristics that separate them from fakes.
Wait for a Candle Close
The single most effective filter is also the simplest: wait for a full candle to close beyond the level. A wick through resistance means nothing if the candle closes back inside the range. A close beyond the level means the market has accepted the new price.
The timeframe matters here. A close on the 4-hour or daily chart carries more weight than a close on the 5-minute chart. Higher timeframes filter out more noise.
Check Volume and Momentum
Genuine breakouts come with expanding activity. In forex, you won’t get centralized exchange volume like stocks, but tick volume serves as a reliable proxy. Look for tick volume that’s at least 50% higher than the 20-bar average on the breakout candle.
Momentum indicators add another layer of confirmation. RSI pushing above 60 on a bullish breakout or below 40 on a bearish one shows directional conviction. MACD crossing above its signal line during the break is another positive sign. If momentum is flat or diverging from price, the breakout is suspect.
Look for a Strong Breakout Candle
The best breakouts produce candles that are at least twice the size of recent average candles. A large-bodied candle with minimal wicks shows strong conviction — buyers (or sellers) were in control for the entire session. Small candles with long wicks at the breakout level suggest indecision, which increases the odds of a fakeout.
Use ATR to Gauge Breakout Quality
The Average True Range (ATR) measures volatility. A quality breakout should move at least 1 ATR beyond the level on the breakout candle. If price barely nudges past resistance by a few pips, that’s not conviction — it’s noise.
ATR also helps you set stops and targets. Place your stop 1 to 1.5 ATR away from your entry, and target at least 2 ATR in profit. This gives you a clean risk-to-reward framework without overthinking it.
Confirm Trend Direction
Breakouts that align with the higher-timeframe trend have significantly better odds of follow-through. If the daily chart is in an uptrend and you’re trading a bullish breakout on the 1-hour chart, you’ve got the wind at your back. Breakouts against the dominant trend are higher risk and require stronger confirmation.
A simple check: is the 50-period moving average sloping in the direction of your trade? If yes, the trend supports your breakout thesis.
The Retest Entry: A Safer Way to Trade Breakouts
Entering on the initial breakout candle is the aggressive approach. It gets you in early but also exposes you to the highest fakeout risk. There’s a more conservative method that many professional traders prefer: the retest.
Here’s how it works:
- Price breaks above resistance (or below support) and closes beyond the level.
- Price pulls back to retest the broken level. Former resistance should now act as support (or vice versa).
- Price holds the retest — typically with a rejection candle like a pin bar or engulfing candle — and resumes the breakout direction.
- You enter on the bounce from the retest with a stop just below the level.
The retest approach has two big advantages. First, it confirms that the level has truly flipped from resistance to support (or support to resistance). Second, it gives you a tighter stop-loss placement, improving your risk-to-reward ratio.
The trade-off? Not every breakout retests. Some move aggressively and never look back. You’ll miss those trades entirely. That’s a price worth paying for the improved win rate and lower risk per trade.
Pro tip: If you’re unsure whether to enter on the breakout or wait for the retest, split your position. Enter half on the breakout and add the other half on the retest. This way you participate in both scenarios.
How to Avoid False Breakouts (Fakeouts)
Fakeouts are the breakout trader’s biggest enemy. Understanding why they happen and how to spot them will save you more money than any entry technique.
Why Fakeouts Happen
Large institutional players need liquidity to fill their orders. They can’t buy millions of dollars’ worth of EUR/USD at a single price without moving the market. So they engineer fakeouts. By pushing price a few pips beyond a key level, they trigger retail stop-losses and limit orders, which provides the liquidity they need to build their actual positions.
This is why breakouts often fail at obvious levels. The more obvious the level, the more stops sitting just beyond it, and the more attractive it is for institutional stop hunts.
Fakeout Warning Signs
Watch for these red flags before and during a breakout:
- Low volume on the break: Real breakouts need fuel. If volume is below average when price crosses the level, be skeptical.
- Long wicks beyond the level: If candles are poking through resistance but closing back below, that’s rejection — not a breakout.
- Breakout during low-liquidity sessions: Moves during the late New York or pre-Tokyo session have less follow-through. The London and New York opens produce the most reliable breakouts.
- Breaking against the dominant trend: A bearish breakout during a strong uptrend is more likely to be a fakeout than a genuine reversal.
- Momentum divergence: Price makes a new high but RSI makes a lower high. That divergence warns you that buying pressure is drying up.
- News-driven spikes: Breakouts triggered by a single news release can reverse just as quickly once the initial reaction fades. Wait for the dust to settle.
The Two-Candle Rule
A simple but effective fakeout filter: require two consecutive candle closes beyond the level before entering. This additional confirmation eliminates most single-candle fakeouts. It costs you a slightly later entry, but it dramatically reduces the false signal rate.
Best Timeframes for Forex Breakout Trading
The timeframe you trade depends on your style and schedule. Each has its strengths.
Daily and 4-hour charts produce the most reliable breakouts. The higher timeframe filters out intraday noise and gives you cleaner levels. These suit swing traders who check charts once or twice a day.
The 1-hour chart is a solid middle ground for active traders. It offers enough detail for precise entries without drowning you in noise. Most breakout strategies work well on this timeframe.
The 15-minute and 5-minute charts are for day traders who want to capture session breakouts — particularly the London and New York opens. The trade-off is more false signals and tighter risk management requirements.
A practical approach is multi-timeframe analysis: identify breakout levels on the daily or 4-hour chart, then drop to the 1-hour or 15-minute chart for your entry. This gives you the best of both worlds — reliable levels with precise timing.
Best Currency Pairs for Breakout Trading
Breakout strategies work best on pairs that show clear periods of consolidation followed by expansion. The major pairs generally offer the best combination of liquidity and volatility.
- EUR/USD: The most liquid pair. Breakouts from the Asian range during the London open are a staple setup.
- GBP/USD: Higher volatility than EUR/USD. Produces larger moves on breakouts but also wider stops.
- USD/JPY: Tends to respect horizontal levels cleanly. Good for range breakout strategies.
- GBP/JPY: A volatile cross pair that delivers powerful breakout moves. Not for the faint-hearted — wider stops are necessary.
- EUR/GBP: Often range-bound, making it ideal for identifying tight consolidation patterns ahead of economic data releases.
Avoid trading breakouts on exotic pairs with wide spreads. The spread eats into your risk-to-reward ratio and makes tight entries impractical.
Building a Forex Breakout Trading Plan
A strategy without a plan is just gambling. Here’s a step-by-step framework you can follow for every breakout trade.
Step 1: Identify the Level or Pattern
Mark key support, resistance, and pattern boundaries on your chart. Focus on levels that have been tested at least two or three times. The more touches, the stronger the level — and the more significant the eventual break.
Step 2: Wait for the Setup
Don’t stare at charts all day waiting for a breakout. Set price alerts at your key levels using your trading platform or a tool like TradingView. When price approaches a level, that’s when you start paying attention.
Step 3: Confirm the Breakout
Run through your checklist:
- Has the candle closed beyond the level?
- Is volume above average?
- Does momentum support the move?
- Is the breakout aligned with the higher-timeframe trend?
- Is the breakout candle strong (large body, minimal wicks)?
If the answer to most of these is yes, you’ve got a high-probability setup.
Step 4: Enter the Trade
Choose your entry method: immediate entry on the breakout candle close, or a limit order at the broken level for a retest entry. Set your stop-loss on the opposite side of the breakout level — typically 1 to 1.5 ATR away.
Step 5: Manage the Trade
Set your initial profit target at 2 to 3 times your risk. For pattern breakouts (flags, triangles), use the measured move technique: project the height of the pattern from the breakout point.
Once price has moved 1R in your favor, move your stop to breakeven. This turns the trade into a free trade and removes the psychological pressure.
Step 6: Review and Log
After the trade closes, log it in your trading journal. Note the pattern, timeframe, confirmation signals, and outcome. Over time, you’ll see which setups work best for your style and which ones to skip.

Automating Breakout Strategies with a VPS
Breakouts don’t wait for you to be at your desk. The best setups often trigger during the London or New York session opens, and if you’re sleeping or working, you’ll miss them entirely.
This is where automating your breakout strategy on a VPS makes sense. Expert Advisors (EAs) on MT4 VPS or MT5 can monitor your levels 24/5, execute the moment a confirmed breakout occurs, and manage the trade according to your rules — all without you touching a button.
For a breakout EA to work properly, it needs consistent uptime and fast execution. A missed breakout entry by even a few seconds can turn a winning trade into a losing one. Running your EA on a forex VPS with sub-millisecond latency to your broker ensures your orders hit the market the instant conditions are met.
Check our trading VPS plans to make sure your automated breakout strategy runs without interruption.
Frequently Asked Questions
What is the best indicator for confirming forex breakouts?
There’s no single best indicator, but a combination works well. Use tick volume to gauge participation, RSI or MACD for momentum confirmation, and ATR to measure the quality of the breakout move. Many professional traders rely on price action alone — waiting for a strong candle close beyond the level is the most reliable confirmation signal.
How do I avoid false breakouts in forex?
Wait for a full candle close beyond the level rather than entering on the first wick through. Check that volume is above average, momentum is aligned, and the breakout is in the direction of the higher-timeframe trend. Applying the two-candle rule — requiring two consecutive closes beyond the level — eliminates most single-candle fakeouts.
What timeframe is best for breakout trading?
The 4-hour and daily charts produce the most reliable breakouts with the lowest false signal rate. Day traders can use the 1-hour or 15-minute chart for session breakouts, but expect more noise. Multi-timeframe analysis — identifying levels on the daily chart and entering on a lower timeframe — is the most effective approach.
Should I enter on the breakout or wait for a retest?
Both approaches are valid. Entering on the breakout gives you the best price but higher fakeout risk. Waiting for a retest gives you a tighter stop and better risk-to-reward ratio but means you’ll miss breakouts that don’t pull back. Splitting your position between both entries is a practical compromise.
Which currency pairs are best for breakout trading?
Major pairs like EUR/USD, GBP/USD, and USD/JPY work best due to their liquidity and clean price action. GBP/JPY is excellent for aggressive traders who want larger moves. Avoid exotic pairs with wide spreads, as the cost of entry reduces your edge.
Can I automate a forex breakout strategy?
Yes. Breakout strategies are well-suited for automation because the rules are objective — price either closes beyond a level or it doesn’t. Expert Advisors on MT4/MT5 can monitor levels, confirm breakouts, execute entries, and manage trades 24/5. Running your EA on a VPS ensures it never misses a setup due to internet or power issues.
How much should I risk per breakout trade?
Risk 1 to 2% of your account per trade. Place your stop-loss 1 to 1.5 ATR beyond the breakout level and size your position accordingly. Set a daily loss limit of 3% — if you hit two or three losing breakout trades in a day, stop trading and review your setups.

About the Author
Matthew Hinkle
Lead Writer & Full Time Retail Trader
Matthew is NYCServers' lead writer. In addition to being passionate about forex trading, he is also an active trader himself. Matt has advanced knowledge of useful indicators, trading systems, and analysis.