
Bollinger Bands In Forex Trading: Overview and Strategy Guide
Learn how to use Bollinger Bands in forex trading. Master the squeeze, mean reversion, and trend strategies with this complete beginner’s guide to volatility trading.

What Are Bollinger Bands?
If you’re new to forex trading, you’ve probably heard traders mention “the bands” or “Bollinger Bands.” But what exactly are they?
Bollinger Bands are a technical indicator invented by John Bollinger in the 1980s. Bollinger, an American financial analyst, developed them while trading options and studying market volatility. At the time, traders used fixed-width trading bands that didn’t adapt to changing market conditions. Bollinger’s breakthrough was creating bands that expand and contract based on volatility using a mathematical concept called standard deviation.
Here’s the simple version: Bollinger Bands help you see whether a currency pair’s price is high or low relative to its recent trading range. They also tell you how volatile (how much the price is moving around) the market is at any given moment.
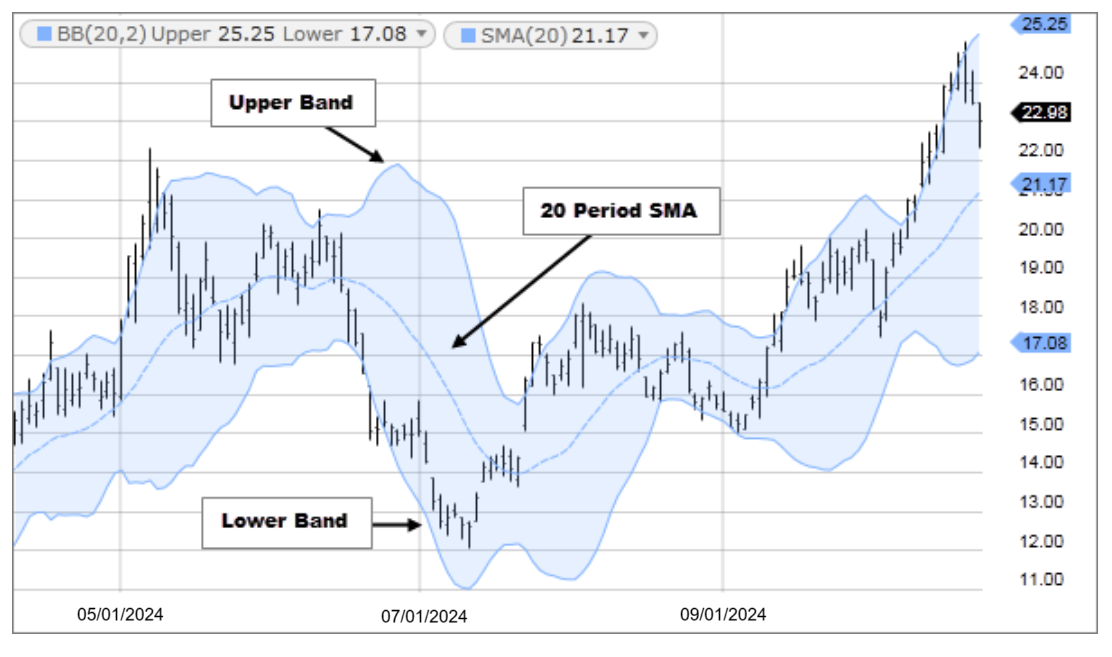
The indicator consists of three lines plotted on your price chart:
- The middle band: A 20-period simple moving average (SMA)
- The upper band: The middle band plus 2 standard deviations
- The lower band: The middle band minus 2 standard deviations
Don’t worry if “standard deviation” sounds intimidating. We’ll break down what that means in plain English.
Understanding the Three Components
Let’s look at each part of the Bollinger Bands indicator and what it tells you.
The Middle Band: Your Reference Point
The middle band is a 20-period simple moving average (SMA). A moving average is just the average closing price over the last 20 periods (candles on your chart). If you’re looking at a daily chart, it’s the average closing price over the last 20 days. On a 1-hour chart, it’s the last 20 hours.
This middle line represents the “normal” or mean price. It’s where price tends to gravitate toward over time. Think of it like a magnet that price keeps getting pulled back to.
The Upper Band: The High-Volatility Ceiling
The upper band sits 2 standard deviations above the middle band. Standard deviation is a statistical measure of how much prices vary from the average. The bigger the price swings, the higher the standard deviation.
Here’s what you need to know: statistically speaking, about 95% of price action should occur between the upper and lower bands when using 2 standard deviations. When price touches or breaks above the upper band, it’s trading at a statistically high level compared to recent history. This could signal an overbought condition.
The Lower Band: The Low-Volatility Floor
The lower band sits 2 standard deviations below the middle band. When price touches or breaks below the lower band, it’s trading at a statistically low level. This could indicate an oversold condition where price might bounce back up.
The key insight: the bands create a dynamic envelope around price that expands when volatility increases and contracts when volatility decreases.
Standard Settings and When to Adjust Them
The standard Bollinger Bands settings that John Bollinger recommended are:
- Period: 20
- Standard Deviations: 2
- Applied to: Close price
These default settings (often written as “20,2”) work well for most forex traders and timeframes. Whether you’re trading the EUR/USD on a 4-hour chart or the GBP/JPY on a 15-minute chart, the 20,2 settings provide a good starting point.
When Should You Adjust the Settings?
While the standard settings work for most situations, you might adjust them based on your trading style:
Shorter Period (10-15)
If you’re a scalper or day trader looking for faster signals, you might reduce the period to 10 or 15. This makes the bands more responsive to price changes but also generates more false signals. The bands will hug price more tightly and trigger more frequently.
Longer Period (34-55)
For swing traders or position traders, increasing the period to 34, 50, or even 55 creates smoother bands with fewer fake signals. Research shows that longer periods reduce false breakouts, though the bands become more lagging (slower to react). Periods longer than 55 become too lagging and take into account prices that are too old to be relevant.
Adjusting Standard Deviations
You can also modify the standard deviation multiplier:
- 1.5 standard deviations: Creates tighter bands that price touches more frequently, useful for more active trading but produces more false signals
- 2.5 or 3 standard deviations: Creates wider bands that price touches less often, useful for identifying extreme market conditions
Our recommendation: Start with the standard 20,2 settings. Trade with them for at least a month. Only adjust after you’ve developed a feel for how the bands behave with your chosen currency pairs and timeframes. Avoid over-optimization where you tweak settings to fit past price action perfectly, as this usually fails in live trading.
Reading Bollinger Bands: What the Bands Tell You
Now that you understand what the bands are, let’s decode what they’re telling you about the market.
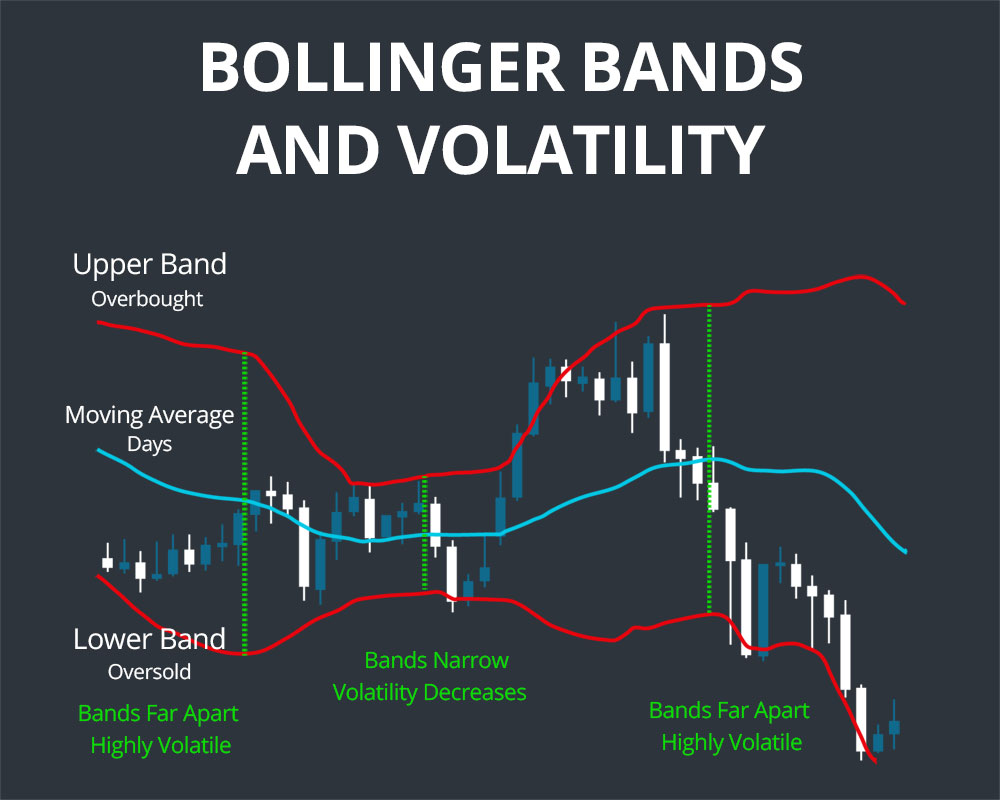
Volatility Expansion (Bands Widening)
When the distance between the upper and lower bands increases, you’re seeing volatility expansion. The bands are widening because price is making bigger moves.
What this tells traders:
- Strong directional momentum is occurring
- A trend is likely developing or strengthening
- Major news events or market sentiment shifts are driving prices
- This is a good time for trend-following strategies
Example: After a major Federal Reserve interest rate announcement, the EUR/USD might see the bands widen dramatically as traders rush to position themselves based on the news.
Volatility Contraction (Bands Narrowing)
When the bands move closer together, you’re seeing volatility contraction. Price is making smaller moves and consolidating in a tight range.
What this tells traders:
- The market is in a period of indecision
- Traders are waiting for the next catalyst
- A significant move is likely approaching (but direction is unknown)
- This sets up the “squeeze” pattern we’ll discuss next
Example: During Asian trading sessions when liquidity is lower, you might see the bands tighten on major pairs as traders wait for London or New York sessions to open.
The Mean-Reverting Nature of Volatility
Here’s a critical concept: volatility is mean-reverting. This means markets naturally cycle between periods of high volatility and low volatility. Prices move from quiet consolidation phases to explosive expansion phases, then back again.
This pattern exists across all timeframes and all currency pairs because it reflects human psychology. Periods of agreement (everyone waiting, low volatility) are followed by periods of uncertainty or new information (everyone acting, high volatility).
Understanding this cycle gives you an edge. You can anticipate that quiet periods won’t last forever and that explosive moves will eventually calm down.

The Bollinger Band Squeeze: Trading Low Volatility Breakouts
The Bollinger Band squeeze is one of the most powerful setups you can trade. It occurs when the bands contract to their narrowest width in recent history, signaling that a significant move is imminent.
Why the Squeeze Works
According to John Bollinger himself, “periods of low volatility are often followed by periods of high volatility.” This is the core principle behind the squeeze strategy.
When the bands squeeze together tightly, it means:
- Price volatility has declined significantly
- The market is consolidating
- Pressure is building for a breakout
- The next move could be substantial
Think of it like a coiled spring. The tighter the compression, the more explosive the eventual release.
How to Identify a Bollinger Band Squeeze
Look for these characteristics:
- Narrowing bands: The distance between upper and lower bands is decreasing
- Historical context: The current band width should be near the low end of its range over the past 6 months
- Price consolidation: Price is moving sideways in a tight range
- Low BandWidth: Some traders use a “BandWidth” indicator (upper band value minus lower band value divided by middle band) to quantify the squeeze objectively
Trading the Squeeze Breakout
Here’s the step-by-step process:
Step 1: Identify the Squeeze
Wait for the bands to contract significantly. Don’t jump in during early compression. You want to see the bands at their tightest in recent weeks or months.
Step 2: Wait for the Breakout
The squeeze itself doesn’t tell you which direction price will break. You must wait for confirmation:
- Bullish breakout: Price closes above the upper band with strong momentum
- Bearish breakout: Price closes below the lower band with strong momentum
Step 3: Confirm with Volume (if available)
In forex, volume data isn’t as reliable as in stocks, but if you have access to tick volume or futures volume for major pairs, look for increasing volume on the breakout. This confirms genuine buying or selling pressure.
Step 4: Enter the Trade
Enter in the direction of the breakout. Some traders wait for a pullback after the initial break, while others enter immediately to avoid missing the move.
Step 5: Watch for “Head Fakes”
John Bollinger warns about false breakouts called “head fakes.” This is when price breaks one band, then quickly reverses and breaks the opposite band. To protect yourself:
- Wait for a candle to close beyond the band (not just a wick)
- Use a tight stop loss on the opposite side of the consolidation range
- Consider waiting for a second confirmation candle
Advanced tip: Some traders combine Bollinger Bands with Keltner Channels (which use Average True Range instead of standard deviation) to identify squeezes. When the Bollinger Bands contract inside the Keltner Channels, it signals an extremely tight squeeze with even higher breakout potential.
Example Trade: You notice GBP/USD has been consolidating for 2 weeks with the Bollinger Bands at their narrowest point in 3 months. Price has been bouncing between 1.2650 and 1.2700. You mark your chart and wait. Suddenly, during the London session, price breaks above 1.2700 and closes above the upper Bollinger Band at 1.2715. You enter a long position with a stop loss at 1.2690 (below the consolidation zone). Price rallies to 1.2850 over the next two days as volatility expands.
Bollinger Band Squeeze Explainer Video:
The video below covers what a Bollinger band squeeze is, and the trading strategy around it.
Mean Reversion Strategy: The Bollinger Bounce
While the squeeze strategy trades breakouts from low volatility, the mean reversion strategy does the opposite. It bets that extreme price moves will reverse back toward the average.
The Core Principle
The middle band (the 20-period SMA) represents the mean or average price. When price moves too far away from this average, touching or exceeding the outer bands, there’s a statistical tendency for price to revert back toward the middle.
This happens because:
- Extreme moves often represent emotional overreactions
- Profit-taking occurs after sharp moves
- Statistically, 95% of price action should occur within 2 standard deviations
- When price moves beyond this range, odds favor a return to normal
How to Trade the Bollinger Bounce
For a bullish bounce (buying at the lower band):
- Wait for price to touch or slightly penetrate the lower band
- Look for signs of rejection (long lower wicks, bullish reversal candlestick patterns like hammers or bullish engulfing)
- Enter a long position targeting the middle band
- Place stop loss below the recent swing low or below the lower band
For a bearish bounce (selling at the upper band):
- Wait for price to touch or slightly penetrate the upper band
- Look for signs of rejection (long upper wicks, bearish reversal patterns like shooting stars or bearish engulfing)
- Enter a short position targeting the middle band
- Place stop loss above the recent swing high or above the upper band
When Mean Reversion Works Best
This strategy performs well in:
- Ranging markets: When price is moving sideways without a clear trend
- Low-volatility environments: When the bands are relatively flat and parallel
- Major support/resistance levels: When the band touch coincides with a key level
When to Avoid Mean Reversion
This strategy fails in strong trending markets. If you see the bands widening dramatically with price consistently closing beyond one of the bands, you’re likely in a trend. In these conditions, price can “walk the band” for extended periods without reverting to the mean.
Example Trade: EUR/USD has been ranging between 1.0850 and 1.0950 for a week. You notice price touches the lower Bollinger Band at 1.0865 during early New York session. A hammer candlestick forms, showing rejection of lower prices. You enter a long position at 1.0870 with a stop at 1.0850 and a target at the middle band near 1.0900. Price bounces and reaches 1.0895 within 6 hours, and you close your position for a 25-pip profit.
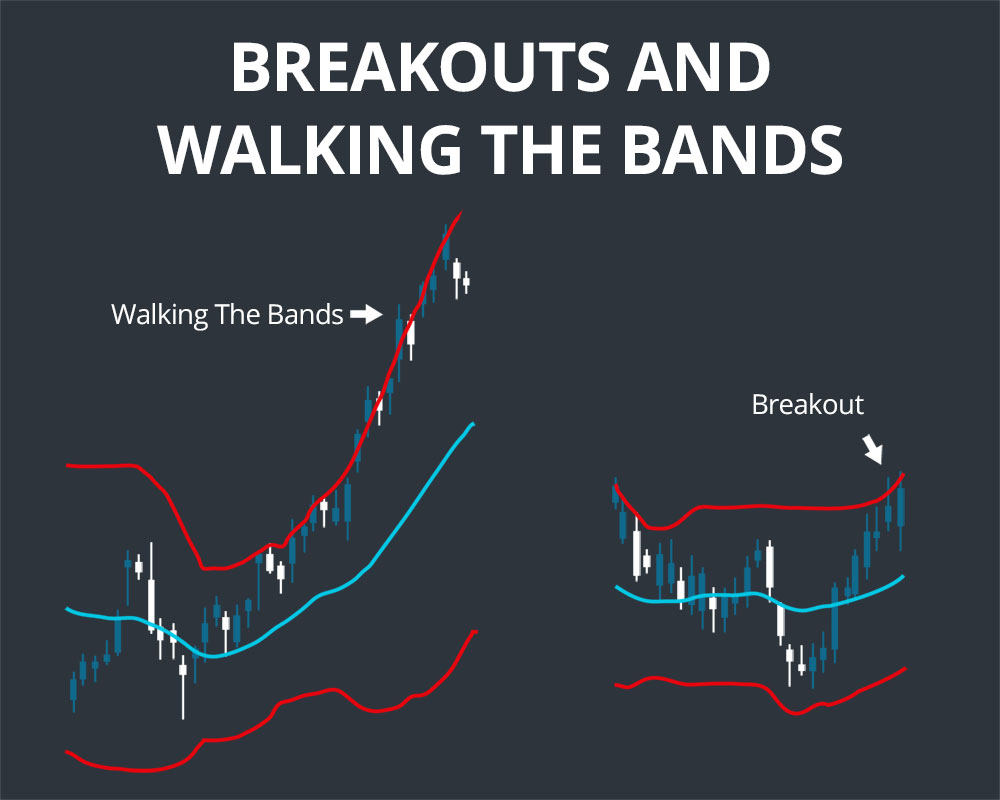
Trend Trading: Walking the Bands
In strong trends, price often “walks” along the upper or lower band for extended periods. This behavior contradicts the mean reversion approach and requires a different strategy.
What “Walking the Bands” Looks Like
In a strong uptrend:
- Price consistently closes near or above the upper Bollinger Band
- The bands are angled upward and widening
- Pullbacks only reach the middle band before resuming higher
- The lower band serves as dynamic support
In a strong downtrend:
- Price consistently closes near or below the lower Bollinger Band
- The bands are angled downward and widening
- Rallies only reach the middle band before resuming lower
- The upper band serves as dynamic resistance
How to Trade Trending Markets with Bollinger Bands
In an uptrend:
- Identify the trend: Price making higher highs and higher lows, upper band sloping upward
- Wait for pullbacks to the middle band (20-period SMA)
- Look for bullish reversal signals when price touches the middle band
- Enter long positions with stops below the lower band
- Target the upper band or trail your stop using the middle band
In a downtrend:
- Identify the trend: Price making lower highs and lower lows, lower band sloping downward
- Wait for rallies to the middle band (20-period SMA)
- Look for bearish reversal signals when price touches the middle band
- Enter short positions with stops above the upper band
- Target the lower band or trail your stop using the middle band
Using a Trend Filter
To avoid counter-trend losses, use a longer-period moving average as a trend filter. Many traders add a 50-period or 200-period SMA to their charts. The rule:
- Only take long setups when price is above the 50-period SMA
- Only take short setups when price is below the 50-period SMA
This simple filter prevents you from trying to fade a strong trend by buying at the lower band when the overall trend is down (or vice versa).
Combining Bollinger Bands with Other Indicators
While Bollinger Bands are powerful, they work best when combined with other technical tools. Here are the most effective combinations:
Bollinger Bands + RSI (Relative Strength Index)
RSI measures momentum and identifies overbought/oversold conditions. Combining it with Bollinger Bands creates high-probability setups.
For mean reversion trades:
- Buy signal: Price touches the lower band AND RSI is below 30 (oversold)
- Sell signal: Price touches the upper band AND RSI is above 70 (overbought)
This combination filters out weak setups. A lower band touch without oversold RSI suggests continued downward momentum. Similarly, an upper band touch without overbought RSI suggests continued upward strength.
Research shows this combined strategy can improve win rates to approximately 55% compared to using Bollinger Bands alone.
Bollinger Bands + MACD (Moving Average Convergence Divergence)
MACD helps confirm momentum and trend direction. Use it to validate Bollinger Band signals.
For trend trades:
- Bullish setup: Price pulls back to middle band during uptrend, MACD shows bullish crossover or is above zero line
- Bearish setup: Price rallies to middle band during downtrend, MACD shows bearish crossover or is below zero line
MACD divergence combined with band touches can also signal potential reversals. If price makes a new low touching the lower band but MACD makes a higher low (bullish divergence), a reversal may be forming.
Bollinger Bands + Volume
Volume confirms the strength of moves. While forex volume data is less reliable than in stocks, tick volume or futures volume can still provide insights.
Key principle: Breakouts from squeezes or band touches should be accompanied by increasing volume. Low-volume breakouts frequently fail.
If price breaks above the upper band on declining volume, be skeptical. The move likely lacks conviction and may reverse quickly.
Bollinger Bands + Support and Resistance
When a Bollinger Band signal aligns with a key support or resistance level, the probability of success increases significantly.
Example: Price touches the lower Bollinger Band at the same level as a major horizontal support zone that’s been tested multiple times. This confluence of technical factors creates a high-probability long opportunity.
Trading Tip: Never rely on Bollinger Bands alone. Always use at least one confirmation indicator (RSI, MACD, volume, or support/resistance). This multi-indicator approach reduces false signals and protects your capital.
Common Mistakes Traders Make with Bollinger Bands
Even experienced traders fall into these traps when using Bollinger Bands. Avoid these mistakes to improve your results.
Mistake 1: Treating Band Touches as Automatic Buy/Sell Signals
The most common error is assuming that touching the upper band means “sell” and touching the lower band means “buy.”
Why this fails: In trending markets, price can ride the upper or lower band for days or weeks. Blindly selling at the upper band during a strong uptrend or buying at the lower band during a strong downtrend leads to repeated losses.
Solution: Always assess the market context first. Is price trending or ranging? Use a trend filter like the 50-period SMA. In uptrends, look for buying opportunities at the middle or lower band, not selling opportunities at the upper band.
Mistake 2: Ignoring the Overall Trend
Traders often focus so intensely on the bands that they ignore the bigger picture. They see a lower band touch and buy without noticing that price has been making lower lows for weeks.
Why this fails: Trading against strong trends is statistically unprofitable. The trend is more likely to continue than reverse at any random band touch.
Solution: Start every analysis by identifying the trend on a higher timeframe. If the daily chart shows a strong downtrend, be very cautious about taking long positions on a 1-hour chart lower band touch.
Mistake 3: Not Waiting for Confirmation
Impatient traders enter positions the moment price touches a band without waiting for signs of reversal or rejection.
Why this fails: Price often penetrates the bands temporarily before continuing in the same direction. Entering too early means your stop loss gets hit before the reversal occurs.
Solution: Wait for confirmation candles. Look for:
- Rejection wicks (long shadows showing failed attempts to continue beyond the band)
- Reversal candlestick patterns (hammers, shooting stars, engulfing patterns)
- A candle closing back inside the bands after briefly penetrating them
Mistake 4: Over-Optimizing Settings for Past Performance
Traders backtest various period and standard deviation settings until they find a combination that worked perfectly on historical data, then use those settings going forward.
Why this fails: Optimizing settings to fit past data perfectly (curve-fitting) usually produces worse results in live trading. Markets change, and what worked in the past won’t necessarily work in the future.
Solution: Stick with the standard 20,2 settings or make only minor adjustments based on your timeframe and trading style. If you must adjust, test the new settings on data that wasn’t part of your optimization sample (out-of-sample testing).
Mistake 5: Using Bollinger Bands in Isolation
Some traders use Bollinger Bands as their only indicator, ignoring momentum, volume, and price structure.
Why this fails: Studies show that Bollinger Bands alone have a win rate of only 33-47% with standard settings. They produce too many false signals without additional confirmation.
Solution: Build a trading system that includes Bollinger Bands plus at least one or two complementary indicators. Popular combinations include Bollinger Bands with RSI, MACD, volume, or moving averages.
Mistake 6: Misjudging Squeeze Direction
Traders assume a Bollinger Band squeeze will break in a certain direction based on hope or bias rather than waiting for the market to show its hand.
Why this fails: The squeeze itself is non-directional. It simply indicates that a big move is coming, not which way price will move. Guessing wrong means entering a trade that immediately goes against you.
Solution: Exercise patience. Wait for the actual breakout to occur and be confirmed before entering. Yes, you might miss the first few pips of the move, but you’ll avoid entering in the wrong direction or getting caught in a head fake.
Warning: Research from multiple backtests shows that none of the Bollinger Bands trading methods exceed 55% success rates when used properly. This means risk management is critical. Even with a 55% win rate, you can lose money if your average loss is larger than your average win. Always use proper position sizing and stop losses.

Bollinger Bands in Automated Trading (Expert Advisors)
Many forex traders automate their Bollinger Bands strategies using Expert Advisors (EAs) on MetaTrader 4 or MetaTrader 5. This approach offers several advantages but also introduces new challenges.
Why Automate Bollinger Band Strategies?
- 24/7 trading: EAs can monitor multiple currency pairs around the clock, catching setups during Asian, European, and American sessions without you staying awake
- Emotion-free execution: Automated systems don’t hesitate, fear, or get greedy. They execute trades exactly as programmed
- Faster reaction times: When the bands squeeze and breakout occurs, EAs can enter positions within milliseconds
- Consistent application: The EA applies your strategy identically to every setup, eliminating discretionary errors
Popular Bollinger Band EA Strategies
Common automated approaches include:
1. Mean Reversion EAs: These EAs buy when price touches the lower band with oversold RSI and sell when price touches the upper band with overbought RSI. They work best during low-volatility, ranging market conditions.
2. Breakout EAs: These monitor for Bollinger Band squeezes and automatically enter trades when price breaks above the upper band (buy) or below the lower band (sell) with confirmation from volume or momentum indicators.
3. Trend-Following EAs: These identify trending markets using the bands’ slope and enter positions on pullbacks to the middle band in the direction of the trend.
4. Multi-Timeframe EAs: More sophisticated EAs check Bollinger Band conditions across multiple timeframes before entering. For example, they might only take long positions when price is above the middle band on both the 4-hour and daily charts.
Critical: Why Bollinger Band EAs Need a Forex VPS
If you’re running an automated Bollinger Bands strategy, a forex VPS isn’t optional, it’s essential. Here’s why:
Timing is critical for band touches: When price touches the upper or lower band and your EA receives a signal to enter, every millisecond matters. The difference between 1ms latency (what you get with a VPS) and 100ms latency (typical home internet) can mean the difference between entering at the band touch or missing the entry as price bounces away.
Squeeze breakouts happen fast: The Bollinger Band squeeze strategy requires immediate execution when the breakout occurs. Delays of even a few seconds can result in worse fill prices or missed opportunities entirely.
24/7 reliability: Your home computer can crash, lose internet connection, or require a Windows update at the worst possible moment. A MT5 VPS runs continuously without interruption, ensuring your EA never misses a setup.
Multiple EA instances: Many traders run Bollinger Band strategies across multiple currency pairs simultaneously. A VPS provides the consistent processing power needed to manage multiple EAs without performance degradation.
At NYCServers, we’ve seen traders improve their automated Bollinger Band strategy performance by 15-20% simply by moving from a home computer to a low-latency VPS located near their broker’s servers.
Learn More: If you’re serious about automated trading, check out our guide on forex algorithmic trading strategies to see how Bollinger Bands fit into broader automated systems.
Frequently Asked Questions
What are Bollinger Bands in forex trading?
Bollinger Bands are a technical indicator invented by John Bollinger in the 1980s. They consist of three lines: a middle band (20-period simple moving average) and two outer bands positioned 2 standard deviations above and below the middle band. They measure price volatility and help traders identify overbought and oversold conditions.
What is the Bollinger Band squeeze strategy?
The Bollinger Band squeeze occurs when the bands contract due to low volatility. This period of consolidation often precedes a significant price breakout. Traders watch for the squeeze, then wait for price to break above the upper band (bullish signal) or below the lower band (bearish signal) to enter trades.
What are the standard Bollinger Bands settings?
The standard settings are a 20-period simple moving average for the middle band and 2 standard deviations for the upper and lower bands. These settings work well for most timeframes and forex pairs. Adjust to 10-period for faster signals or 34-50 period for longer-term trends.
Can Bollinger Bands be used alone for trading?
No, Bollinger Bands should not be used as a standalone indicator. They work best when combined with other tools like RSI for overbought/oversold confirmation, MACD for momentum, or volume indicators. This multi-indicator approach reduces false signals and improves trading accuracy.
How accurate are Bollinger Bands for forex trading?
Studies show Bollinger Bands with standard settings have a 47-55% success rate depending on market conditions and timeframe. They perform better in ranging markets for mean reversion strategies but can produce false signals in strong trends. Always use with confirmation indicators and proper risk management.
Why do I need a VPS for Bollinger Band trading strategies?
Expert Advisors (EAs) running Bollinger Band strategies need stable, low-latency execution to capitalize on quick band touches and breakouts. A forex VPS ensures your automated strategies run 24/7 with minimal lag, preventing missed entries when volatility spikes occur.
What’s the difference between band expansion and contraction?
Band expansion (widening) signals increasing volatility and strong directional movement. Band contraction (narrowing) indicates decreasing volatility and potential consolidation. Markets cycle between these states, making volatility mean-reverting and somewhat predictable.
Can I use Bollinger Bands for scalping?
Yes, Bollinger Bands work for scalping when you adjust the settings appropriately. Use a shorter period (10-15) for faster signals on 1-minute or 5-minute charts. Combine with other fast indicators like Stochastic or RSI for confirmation. Be aware that shorter periods generate more false signals, so strict risk management is essential.
What currency pairs work best with Bollinger Bands?
Bollinger Bands work on all currency pairs because they adapt to the volatility of each pair. Major pairs like EUR/USD, GBP/USD, and USD/JPY have sufficient liquidity and smoother price action, making them ideal for beginners. Exotic pairs tend to have wider bands due to higher volatility and may require adjusted settings.
How do I know if the market is trending or ranging for Bollinger Band strategies?
Look at the angle and behavior of the bands. In trending markets, the bands slope clearly upward or downward, widen consistently, and price tends to walk along one of the outer bands. In ranging markets, the bands are relatively flat and parallel, and price bounces between the upper and lower bands regularly. Adding a longer moving average (50 or 200 period) helps confirm the trend direction.
Final Thoughts: Mastering Bollinger Bands Takes Practice
Bollinger Bands are one of the most versatile and widely-used indicators in forex trading for good reason. They help you visualize volatility, identify potential reversal points, spot breakout opportunities, and confirm trends.
But like any trading tool, they’re not magic. The bands won’t predict the future with certainty. They simply show you statistical probabilities based on recent price behavior.
Your success with Bollinger Bands depends on:
- Understanding market context: Are you in a trend or range? High or low volatility?
- Using confirmation indicators: RSI, MACD, volume, support/resistance levels
- Practicing patience: Wait for proper setups rather than forcing trades
- Managing risk: Use appropriate stop losses and position sizing
- Gaining experience: Study how the bands behave on your chosen pairs and timeframes
Start with the standard 20,2 settings on a demo account. Trade the basic strategies we’ve covered: the squeeze, mean reversion, and trend pullbacks. Keep a trading journal documenting each setup, why you entered, and what happened. After 50-100 trades, you’ll develop an intuitive feel for how Bollinger Bands behave in different market conditions.
And if you’re running automated strategies using Expert Advisors, remember that consistent execution requires reliable infrastructure. A forex VPS ensures your Bollinger Band EAs never miss an opportunity due to connection issues or computer downtime.
The traders who succeed with Bollinger Bands aren’t necessarily smarter or more talented. They’re simply more disciplined, patient, and willing to learn from both wins and losses. You can do the same.
Happy trading, and may your bands always squeeze before your best trades.

About the Author
Matthew Hinkle
Lead Writer & Full Time Retail Trader
Matthew is NYCServers' lead writer. In addition to being passionate about forex trading, he is also an active trader himself. Matt has advanced knowledge of useful indicators, trading systems, and analysis.