
RSI Trading Strategy in Forex: Settings and Setups
Learn how to trade forex with an RSI trading strategy: settings, overbought/oversold signals, divergence, the 50 line, and how to avoid false signals.
RSI trading strategy signals are most useful in forex when you filter them by trend and confirm them with price structure. The quick verdict: do not buy only because RSI falls below 30 or sell only because it rises above 70. In a strong currency trend, those readings can persist while price keeps moving against a premature reversal trade.
A practical approach starts with the standard 14-period RSI, uses the 50 line to judge momentum direction, and treats overbought, oversold, divergence, and failure swings as setup alerts rather than entries by themselves. Add support or resistance, a higher-timeframe trend, and a clear invalidation point before taking risk.
What Is the RSI Indicator?
The Relative Strength Index, or RSI, is a momentum oscillator that measures the speed and magnitude of recent price changes. It moves between 0 and 100, giving you a compact view of whether bullish or bearish momentum has dominated the selected lookback period.
J. Welles Wilder introduced RSI in 1978 in his book New Concepts in Technical Trading Systems and in the June 1978 issue of Commodities magazine. Wilder’s standard smoothing period was 14, which remains the default on most charting platforms.
The familiar interpretation labels readings above 70 as overbought and readings below 30 as oversold. The 50 line is neutral: readings above it favor bullish momentum, while readings below it favor bearish momentum. None of these levels predicts what price must do next. RSI describes current momentum relative to recent moves; it does not guarantee a reversal.

How Is RSI Calculated?
The calculation separates positive and negative changes over the lookback period. Relative strength, or RS, is the average gain divided by the average loss. RSI then converts that ratio to a 0–100 scale:
RSI = 100 − 100 / (1 + RS)
Wilder smoothed the averages with his smoothed moving average, using an alpha of 1 divided by the period. For a 14-period RSI, that is 1/14. You rarely need to calculate this manually because MT4, MT5, cTrader, and charting platforms do it for you.
Small differences between platforms are possible. Some packages use a standard exponential moving average instead of Wilder’s smoothing, while Cutler’s RSI uses a simple moving average. Check the calculation method before comparing signals or moving an automated strategy between platforms.
Best RSI Settings for Forex
There is no universal best setting for every currency pair and timeframe. A 14-period RSI with 70/30 bands is the sensible baseline. Shorter periods react faster and produce more signals, but they also amplify noise. Longer periods smooth the oscillator and reduce signal frequency.
| Trading style | Starting period | Starting bands | Practical note |
|---|---|---|---|
| Scalping | 7–9 | 80/20 | Fast response, but more false signals; require trend and price confirmation |
| Day trading | 14 | 70/30 | Balanced baseline for testing intraday setups |
| Swing trading | 21+ | 70/30 | Smoother readings with fewer setups |
Treat these as test settings, not prescriptions. In a strongly trending pair that repeatedly reaches 70, moving the upper threshold to 80 can reduce weak counter-trend signals. More extreme 80/20 or 90/10 bands occur less often. Whatever you choose, test it on the same pair, timeframe, spread assumptions, and RSI calculation your live platform will use.
RSI Trading Strategies for Forex
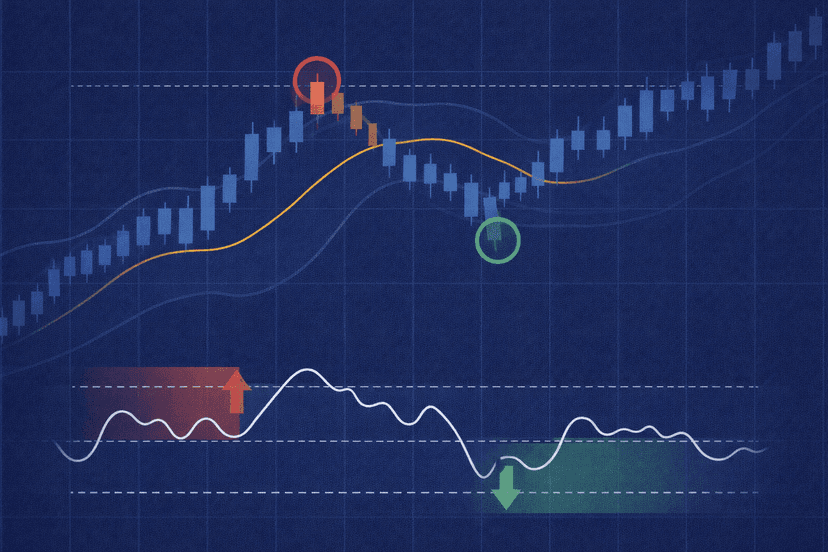
The strongest RSI setups combine a specific momentum condition with a price-based reason to trade. Define the trend, wait for the RSI event, then use market structure to decide whether the setup is valid and where it fails.
Use the same decision sequence on every chart:
- Classify the higher-timeframe market as trending or ranging.
- Mark nearby support, resistance, and recent swing points.
- Wait for the chosen RSI condition on a completed candle.
- Enter only after price confirms the setup, with the invalidation level and target defined in advance.
This sequence separates a repeatable process from a chart observation made after the move.
Overbought and Oversold Reversals
Above 70 means momentum has been strong enough to reach an overbought zone; below 30 means it has reached an oversold zone. It does not mean a reversal has already started. A safer mean-reversion setup waits for RSI to leave the extreme after price rejects a meaningful resistance or support area.
For example, a bullish setup could require price to test established support, RSI to move below 30, and a candle to close back above that level as RSI recovers. In a strong trend, consider 80/20 bands and favor signals aligned with the higher-timeframe direction rather than repeatedly fading momentum.
Regular and Hidden RSI Divergence
Regular divergence warns that price and momentum are no longer confirming each other. Bullish divergence occurs when price makes a lower low while RSI makes a higher low. Bearish divergence occurs when price makes a higher high while RSI makes a lower high. Wilder considered divergence a strong warning that a turning point may be near, but the signal can develop well before price reverses.
Hidden divergence is usually used as a continuation setup. Hidden bullish divergence pairs a higher price low with a lower RSI low; hidden bearish divergence pairs a lower price high with a higher RSI high. Use the existing trend and the break of a nearby swing level for confirmation instead of entering as soon as two RSI pivots appear.
The 50 Line as a Trend Filter
The midline can keep you on the right side of momentum. When RSI holds above 50, prioritize bullish pullback setups; when it holds below 50, prioritize bearish rallies. Repeated rejection of the 50 line can also act like momentum support or resistance.
This filter is simple enough to make your rules objective: allow long entries only above 50 and short entries only below 50. It will miss some early reversals, but it helps block many trades taken solely because the oscillator touched an extreme.
RSI Failure Swings
A failure swing is an oscillator reversal pattern that does not require price divergence. Wilder’s bearish example has RSI reach 76, pull back to 72, rise to 77, and then fall below 72. That break completes a failure swing above 70 and signals that momentum has turned.
The bullish version is the mirror image below 30: RSI makes an extreme low, rebounds, retests without simply continuing lower, and then breaks above its intervening high. Confirm either version with price structure and place the invalidation level on price, not on the oscillator.
RSI Plus Confluence
Confluence means requiring independent evidence. An oversold reading at established support has more context than the same reading in open space. You can combine RSI with horizontal support and resistance, a moving-average trend filter, a rejection candle, or Bollinger Bands in a range.
Keep the rule set small enough to test. One trend filter, one RSI trigger, and one price confirmation are usually clearer than stacking several correlated indicators. Define the stop, target, and risk before entry; RSI itself does not provide a complete risk-management plan.

Common RSI Mistakes and False Signals
The biggest mistake is treating an extreme reading as an order. During strong trends, RSI can remain overbought or oversold for extended periods. Selling every reading above 70 in a rising market can create a series of losses even though each signal looks stretched.
- Fighting the dominant trend: Use the 50 line, higher-timeframe structure, or a moving-average slope to filter counter-trend entries.
- Using RSI alone: Require price to reject or break a defined level before acting on the oscillator.
- Entering before confirmation: Divergence can persist. Wait for price to confirm that momentum loss has affected market structure.
- Over-optimizing settings: A period and band combination fitted to one sample may fail when volatility changes. Test out of sample rather than chasing a perfect backtest.
- Ignoring calculation differences: Match your research and live platform because SMMA, EMA, and SMA-based versions can print slightly different values.
Academic testing by Marek and Šedivá found that RSI could produce good results in some cases but was usually beaten by simple buy-and-hold over long horizons. That does not determine the outcome of a particular forex setup, but it is a useful warning: a familiar indicator is not evidence of a durable standalone edge.

Automating an RSI Strategy
On MT5, the built-in iRSI indicator function makes RSI rules straightforward to code in an Expert Advisor; the same logic can be implemented for MT4 or cTrader. A system can check the RSI period and bands, apply a 50-line or moving-average filter, wait for a candle close, and submit an order only when every condition is true.
Automation makes ambiguous rules obvious. Specify whether a threshold must be touched or crossed, whether signals use the current or completed candle, how many positions may be open, and what happens around spread changes. Backtest with the platform’s exact RSI implementation, then forward-test before risking live capital.
An EA monitoring forex markets 24/5 also needs a machine that remains online. A forex VPS can keep the platform running when your home computer is off and avoid missed checks caused by local power or internet outages. Stable uptime and consistent network latency support execution, but they cannot turn weak entry logic into a profitable strategy.
Conclusion: Use RSI as Confirmation
RSI is best treated as a momentum and timing tool, not a complete trading system. Start with 14 periods and 70/30 bands, filter direction with the 50 line or higher-timeframe trend, and require price confirmation at a meaningful level. If you change the settings, prove the change through testing rather than assuming a faster or smoother RSI is automatically better.
RSI Trading Strategy FAQ
What Is the Best RSI Setting for Forex?
The 14-period RSI with 70/30 bands is the best starting point because it is the standard configuration and balances responsiveness with smoothing. Scalpers may test 7–9 periods, while swing traders may test 21 or more. The best final setting is the one validated for your pair, timeframe, and execution conditions.
Should You Buy When RSI Falls Below 30?
Not automatically. Below 30 shows strong recent downside momentum, and RSI may remain there while price continues falling. Look for support, a trend-compatible setup, RSI recovery, and price confirmation before considering a long entry.
Is RSI Divergence Reliable in Forex?
Divergence is a warning that momentum is weakening, not proof that price will reverse immediately. Its usefulness improves when it forms at a defined support or resistance area and price then breaks a relevant swing level. Without confirmation, divergence can persist through several new highs or lows.
Can You Use RSI for Forex Scalping?
Yes, but shorter settings such as 7–9 periods create more noise as well as more signals. Wider 80/20 bands and a trend filter can reduce weak entries. Include realistic spreads and execution assumptions when testing because a frequent strategy is more exposed to trading costs.
Can an RSI Strategy Be Automated?
Yes. RSI periods, thresholds, midline filters, candle-close confirmation, stops, and targets can all be expressed as objective rules in MT4, MT5, or cTrader. The harder work is defining unambiguous logic and validating it across different market conditions, not calculating the indicator.

About the author
Matthew Hinkle
Lead Writer & Full Time Retail Trader
Matthew is NYCServers' lead writer. In addition to being passionate about forex trading, he is also an active trader himself. Matt has advanced knowledge of useful indicators, trading systems, and analysis.
Areas of Expertise